Horn Lake, Mississippi is an established and strategically positioned city in the northern part of DeSoto County, located just south of the Tennessee border and minutes from downtown Memphis. Its proximity to Interstate 55 provides direct connectivity to the broader Memphis metropolitan area, making it a prime location for residents who work across the region’s logistics, manufacturing, and healthcare industries. This accessibility, combined with competitive home prices and sustained economic activity, positions Horn Lake as an appealing submarket for investors seeking strong rental performance and long-term appreciation within the Memphis MSA.
The city’s population is estimated at around 27,000, and it continues to benefit from the overall growth of North Mississippi. Horn Lake’s employment base is anchored in logistics and distribution—a natural advantage given its adjacency to Memphis, one of the largest freight and transportation hubs in the country. Within the city limits are numerous warehouses and transportation companies, including facilities supporting the operations of FedEx, UPS, and regional carriers. DeSoto County as a whole has become a logistics powerhouse, attracting national and international businesses that rely on quick access to Memphis International Airport, the I-55/I-69 corridor, and the region’s extensive rail and river systems. For real estate investors, this industrial backbone translates to a steady, wage-earning tenant pool and reliable housing demand that supports rental stability year after year.
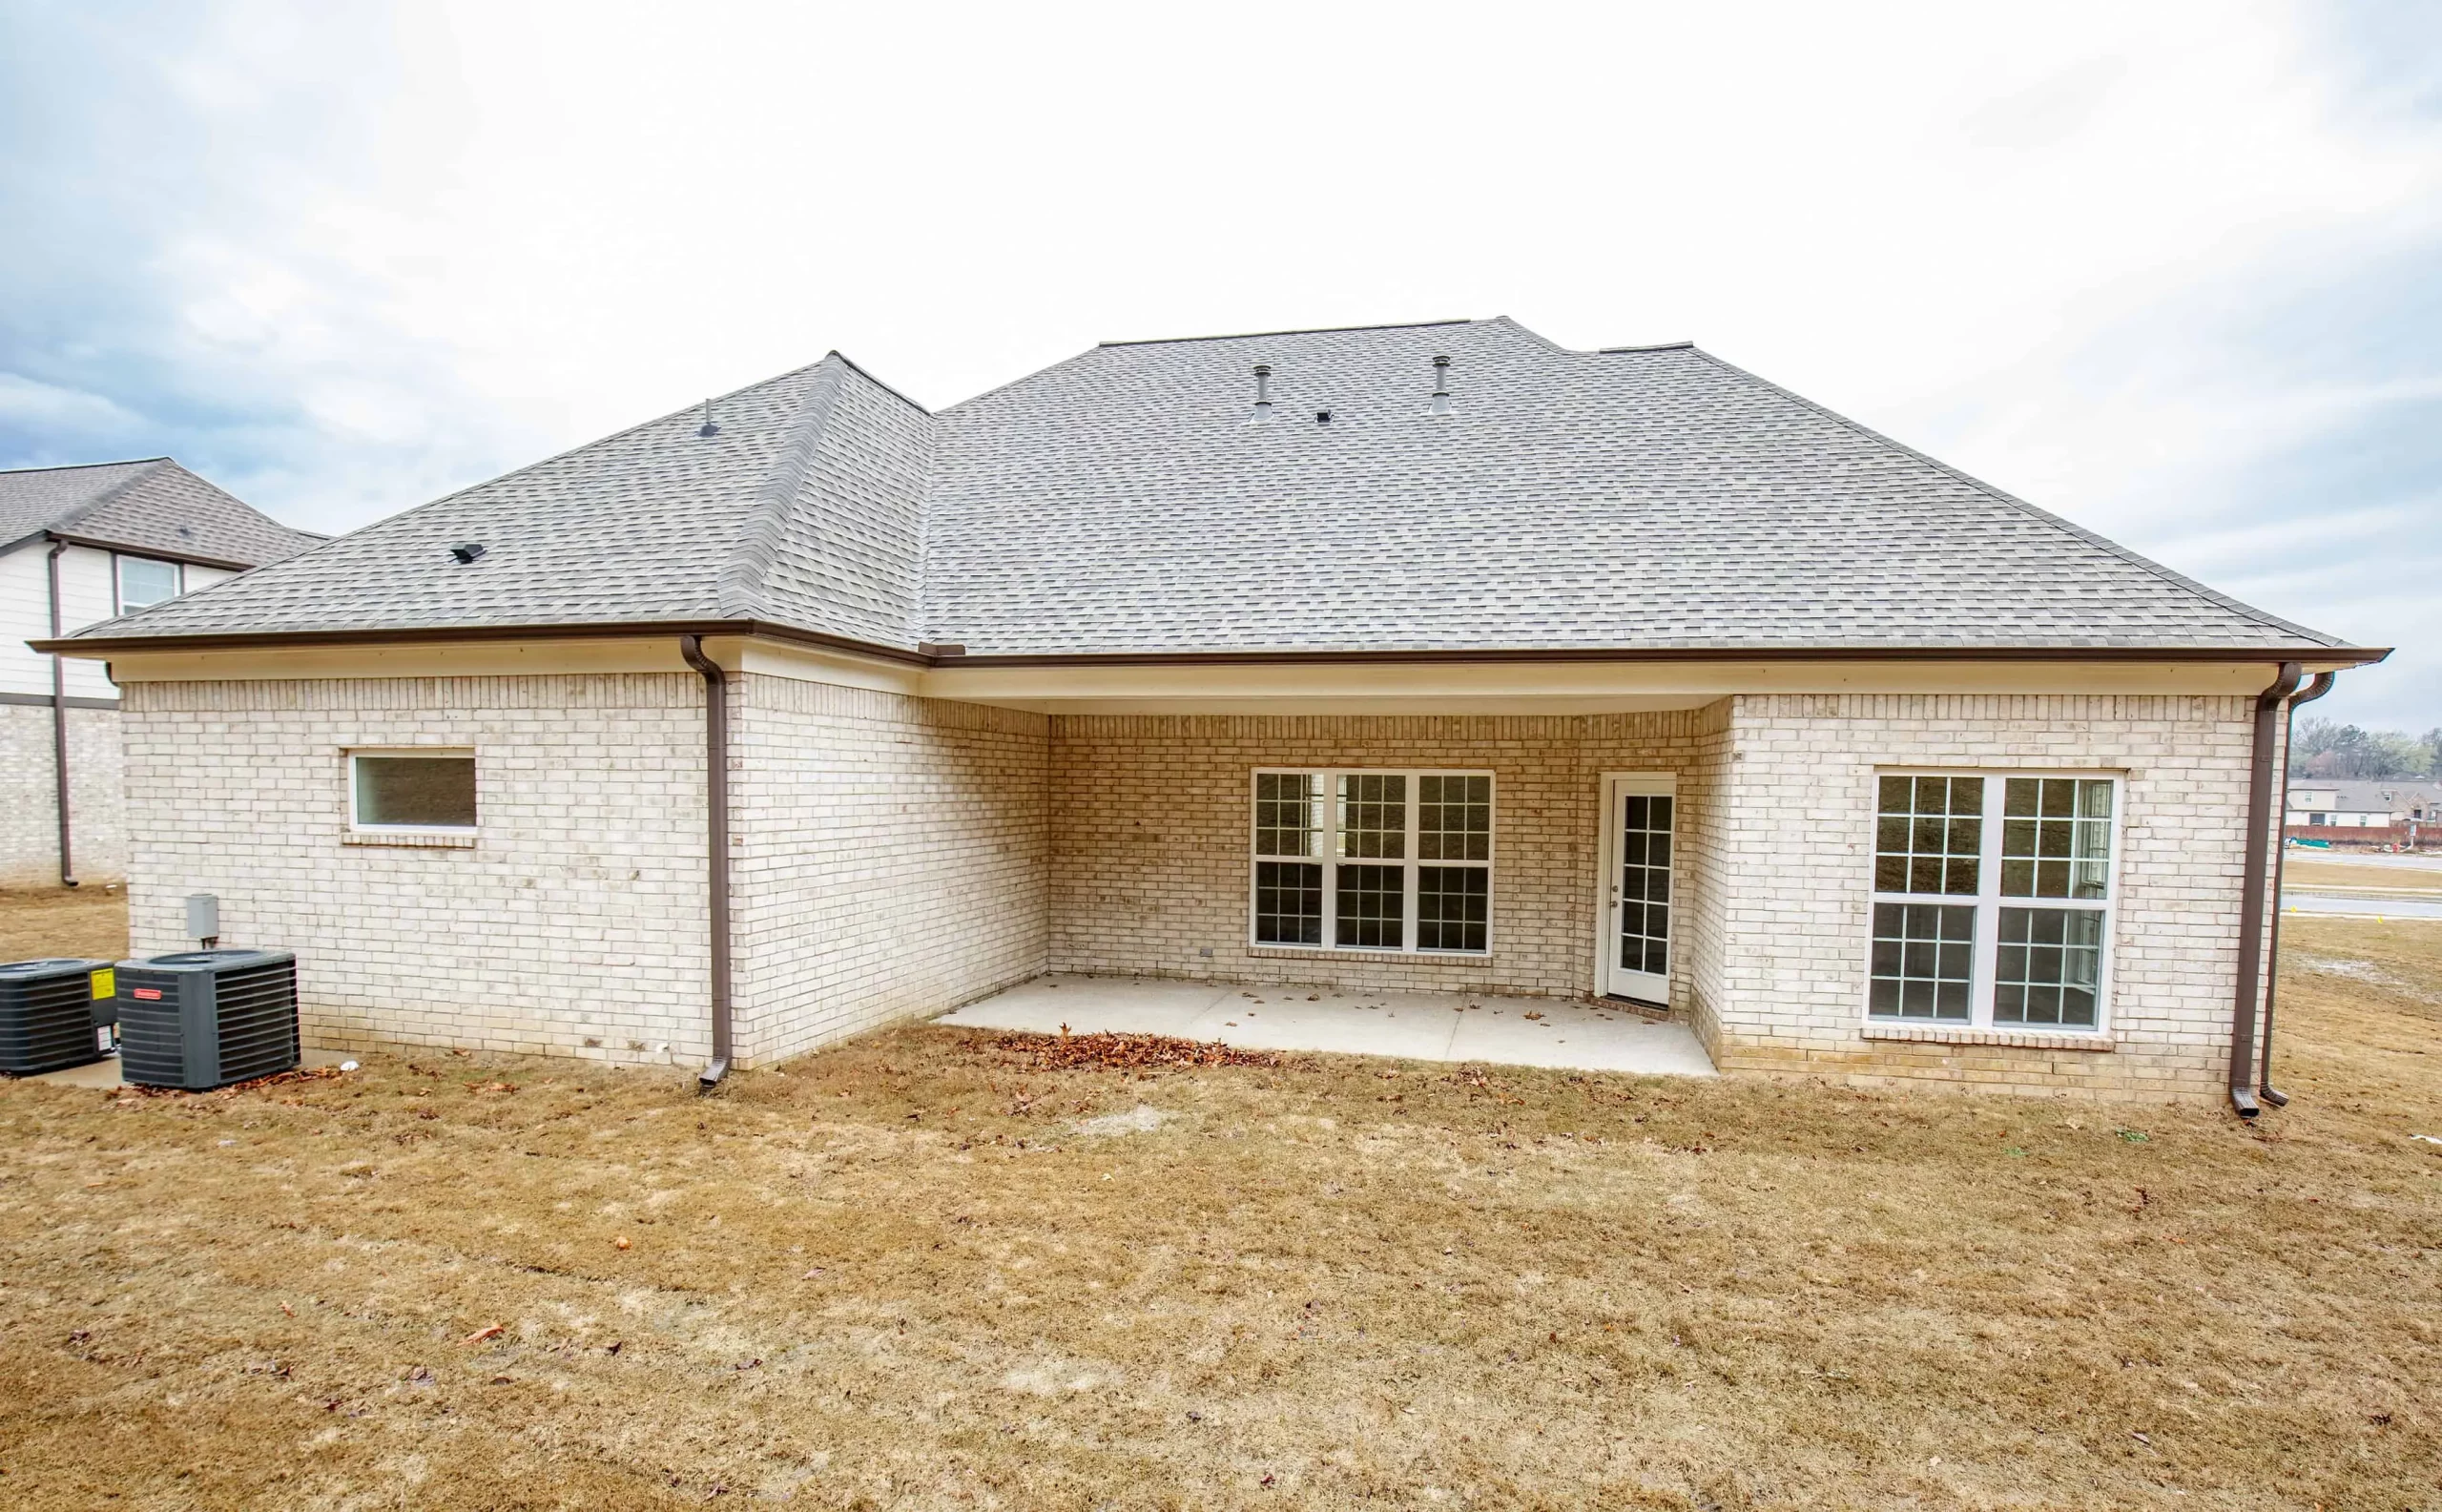
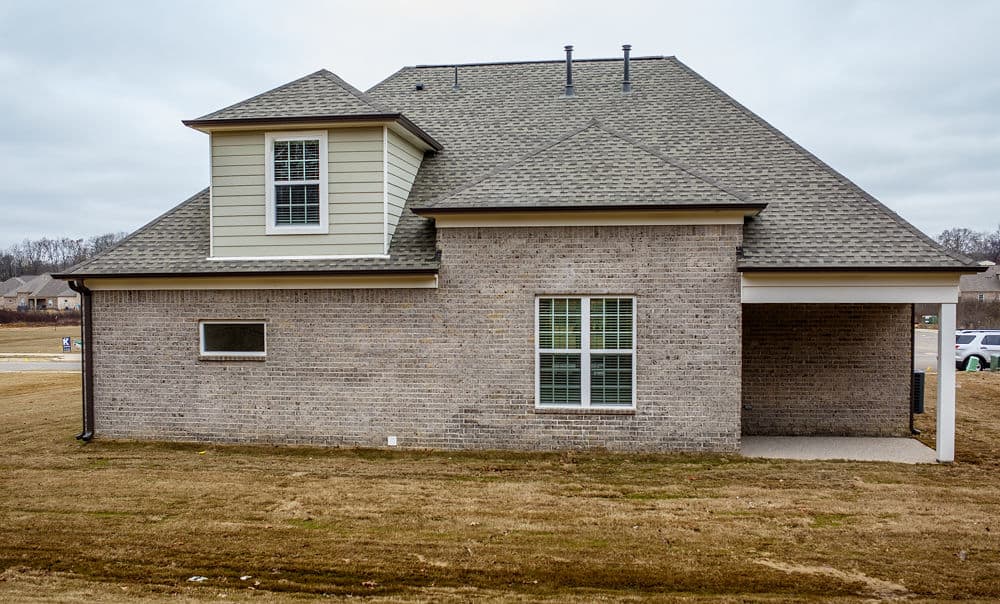
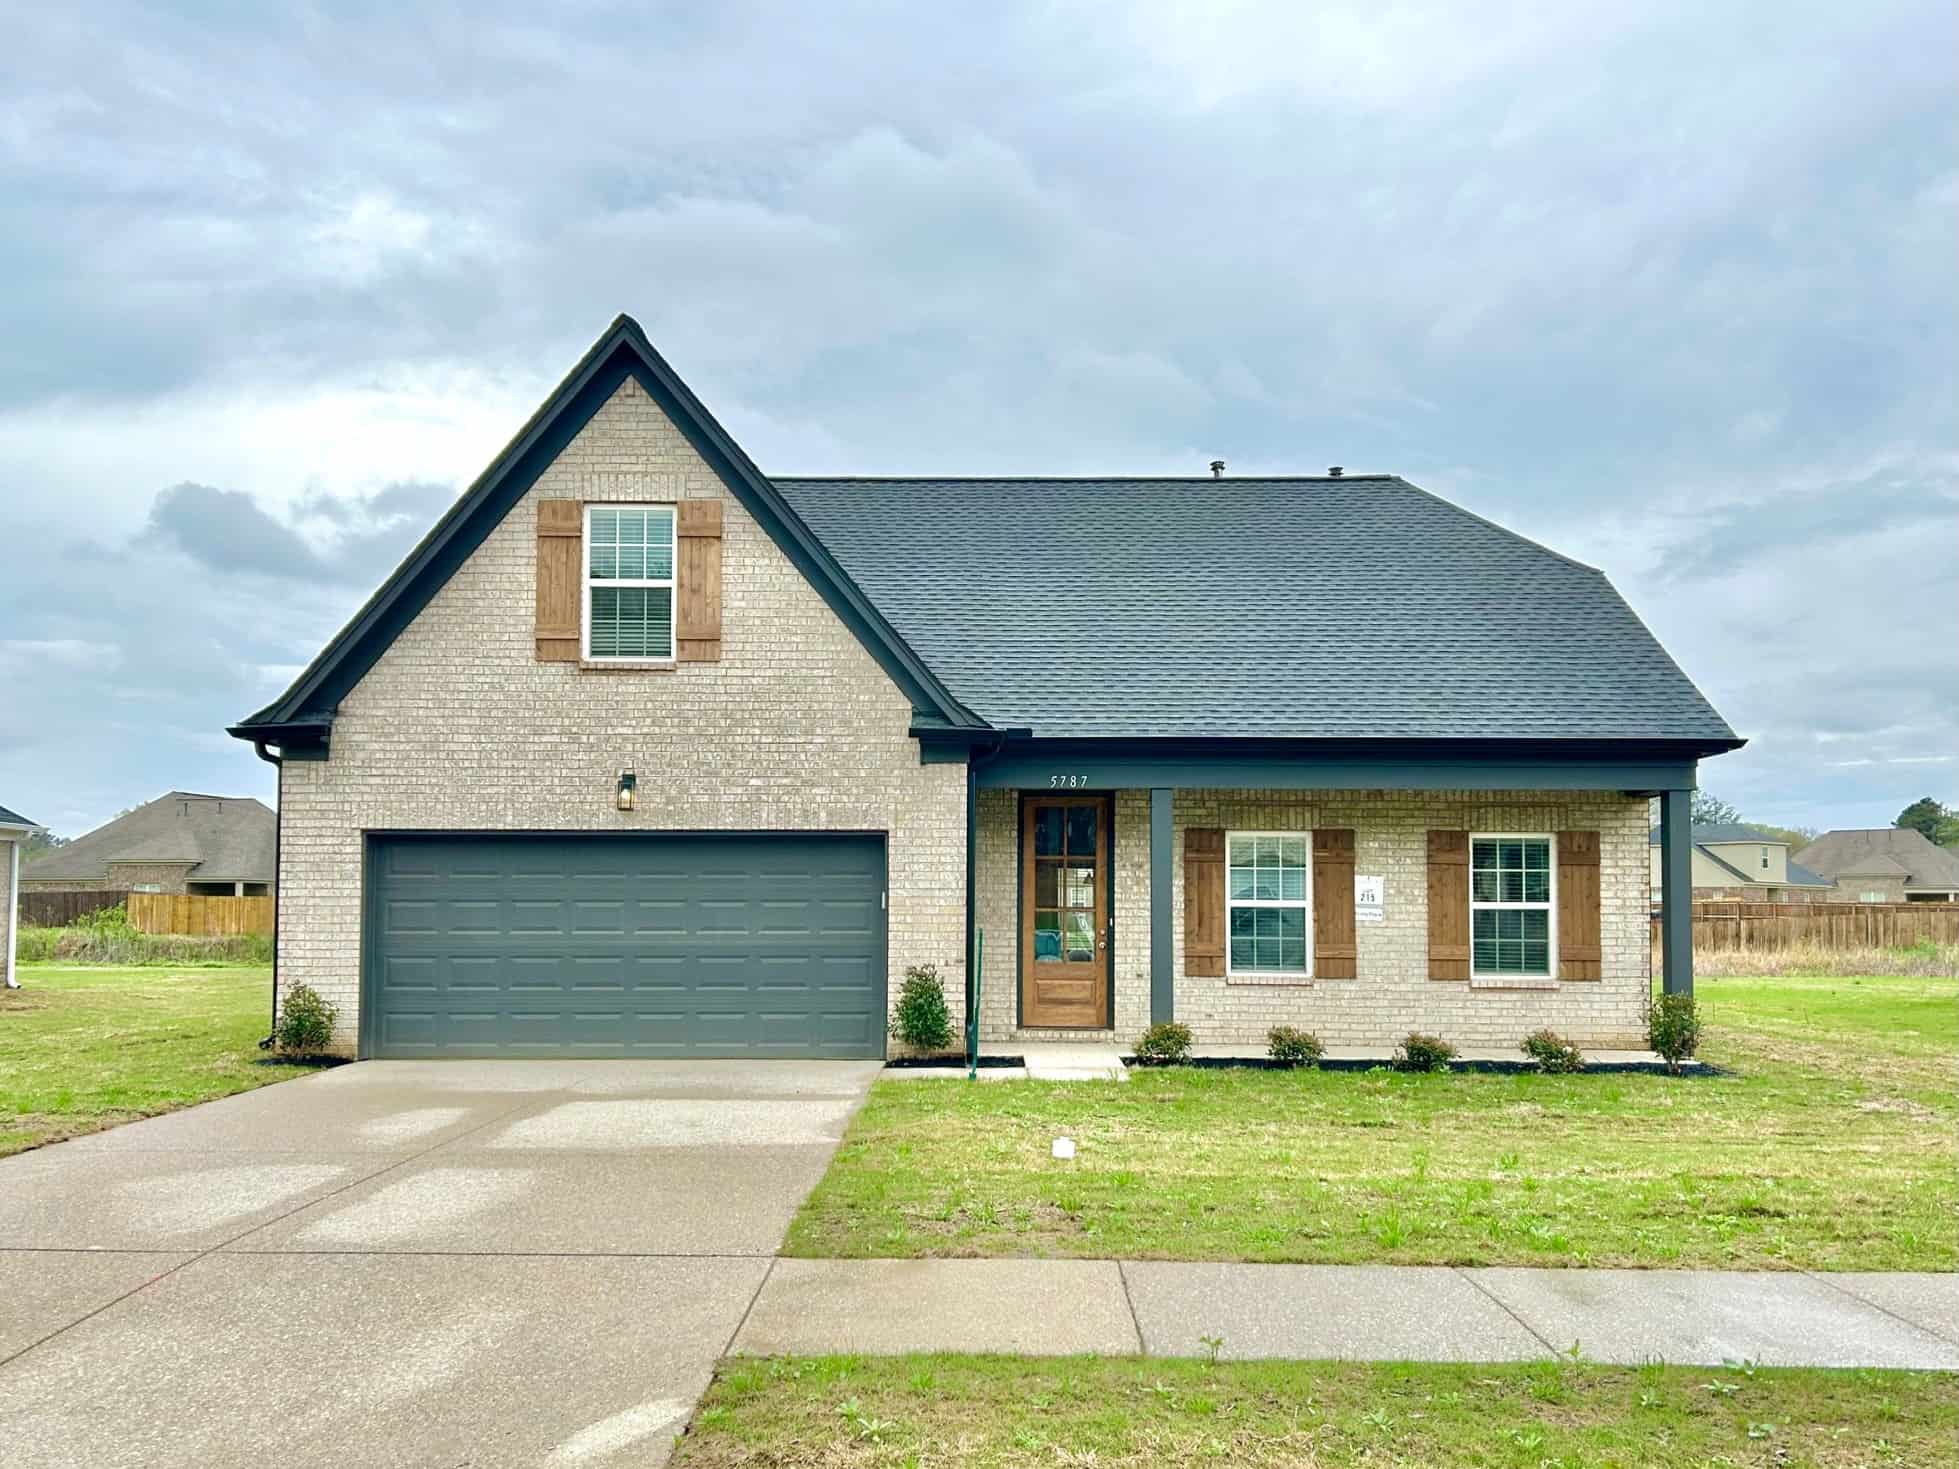
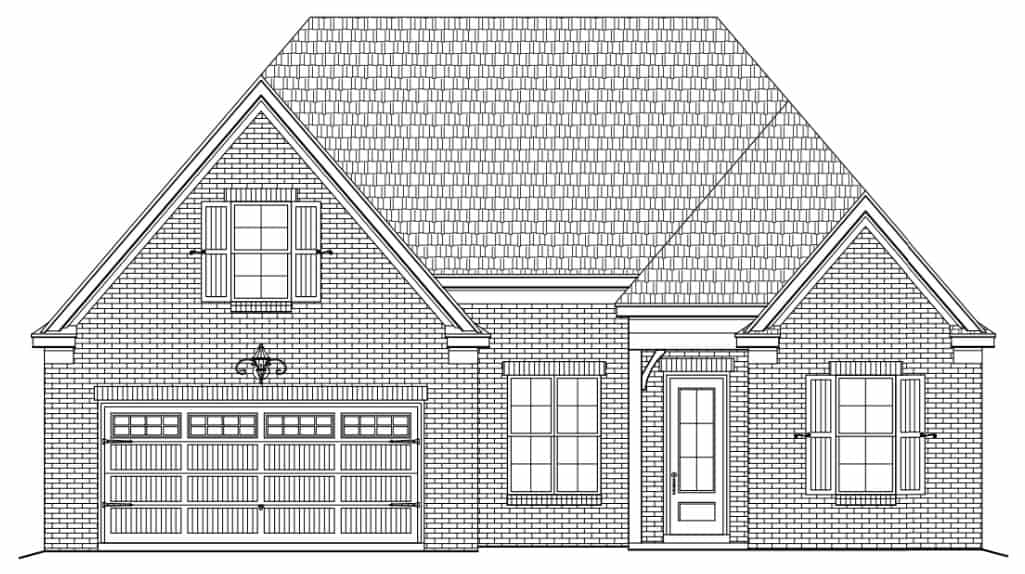
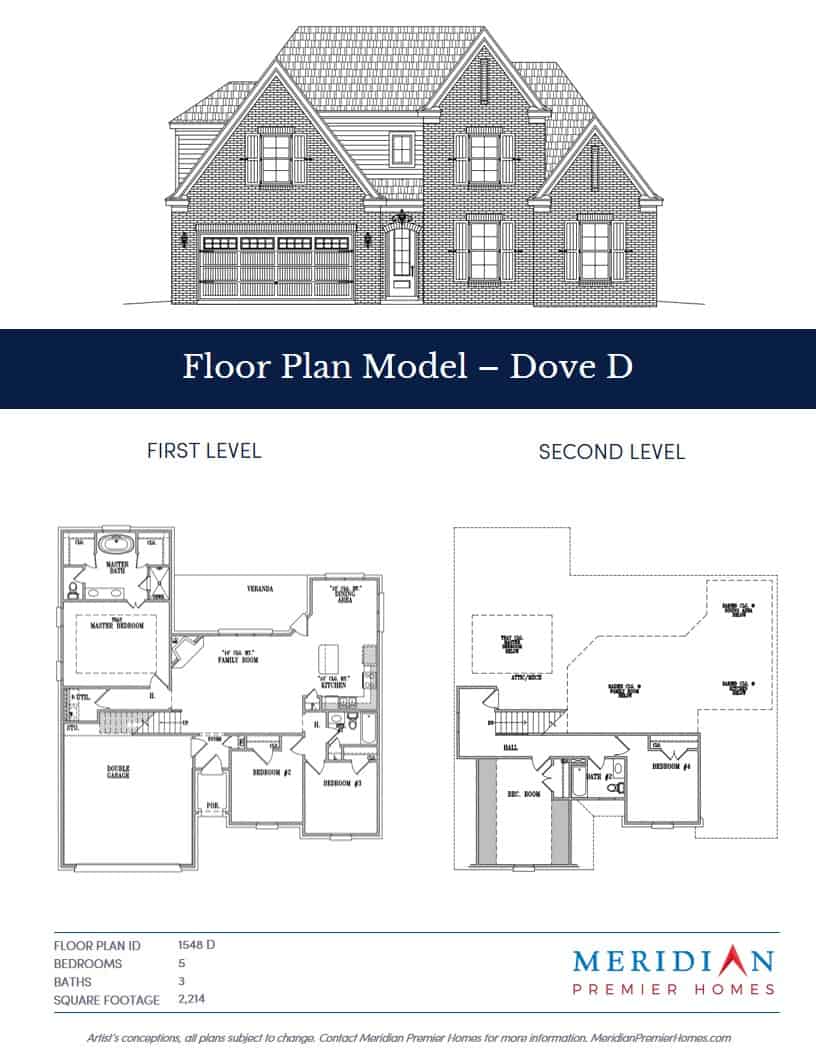
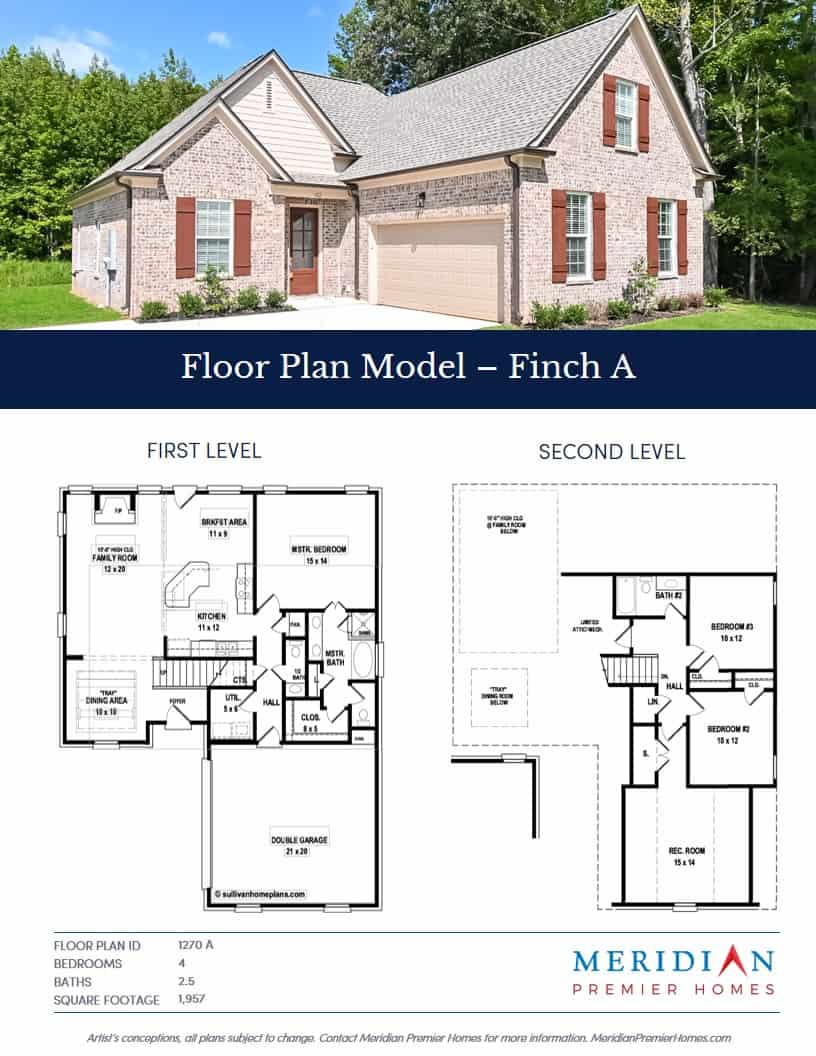
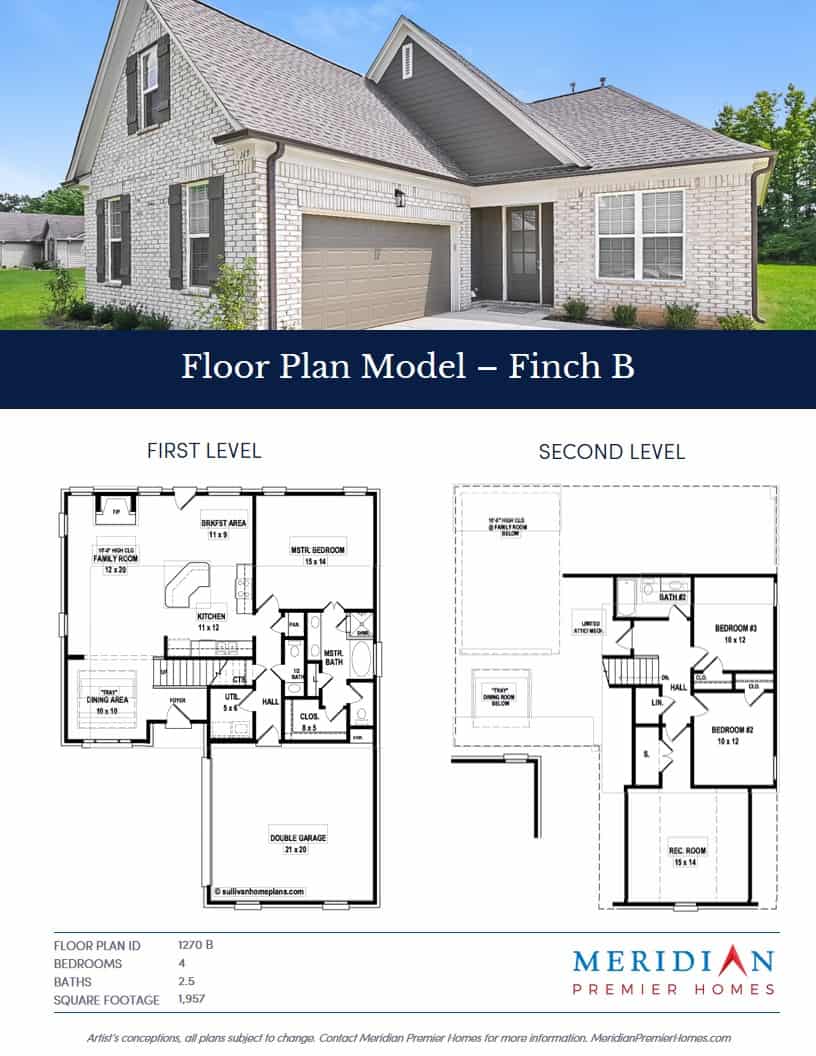
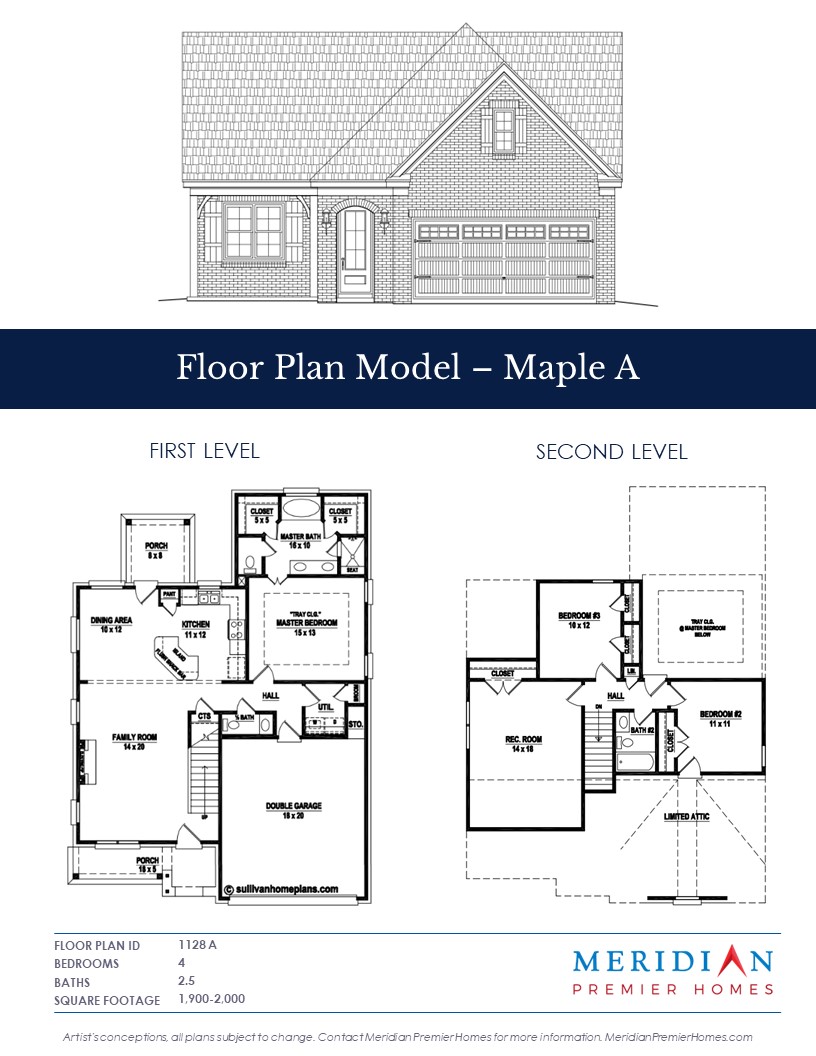
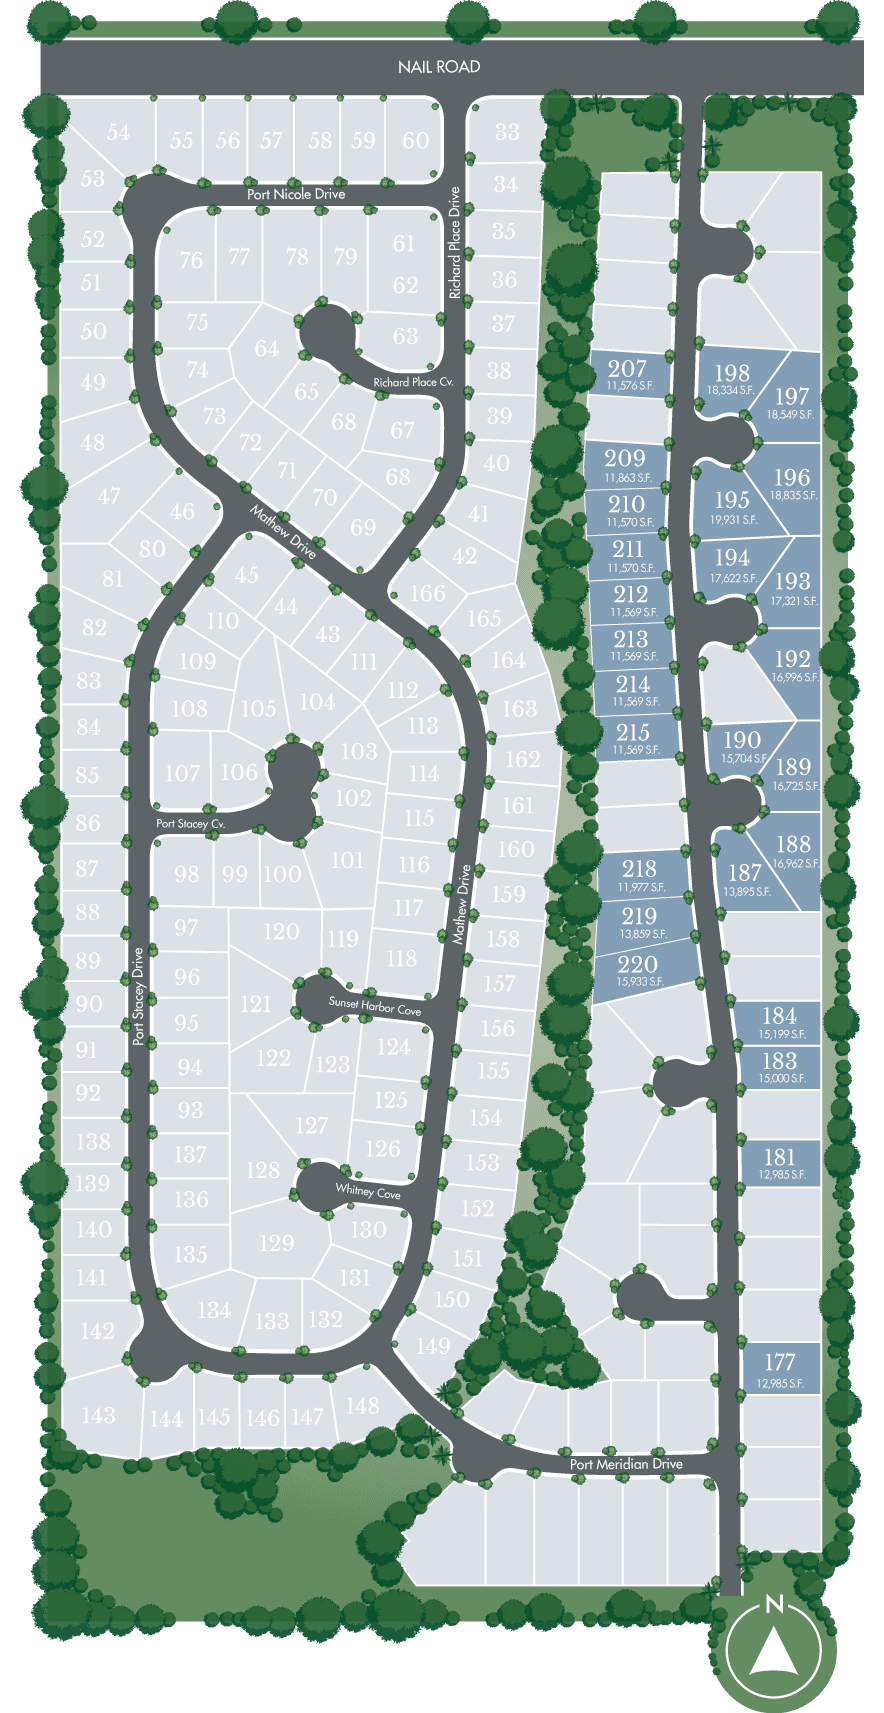
Baker Estates, located to the east of the city of Walls and south of Southaven, sits just minutes from I-55 and benefits from the same transportation and employment infrastructure that defines the area. This location provides residents and tenants with short commutes to major employers while retaining the lower costs and open land opportunities that make Horn Lake and its surrounding communities appealing for new construction and single-family rental investment. As Southaven’s population and commercial footprint expand southward, Horn Lake stands to capture spillover growth in both housing demand and retail development. The city’s proximity to key regional employers—along with new industrial projects across northern Mississippi—reinforces its strength as a long-term investment market.
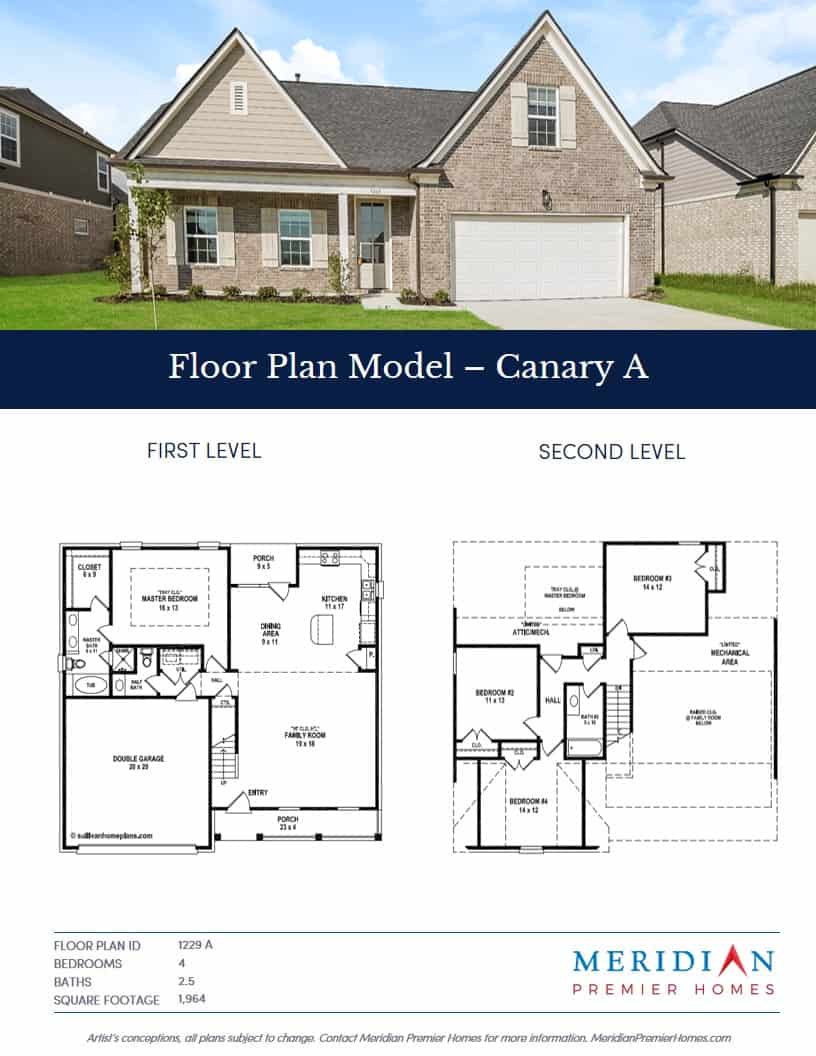
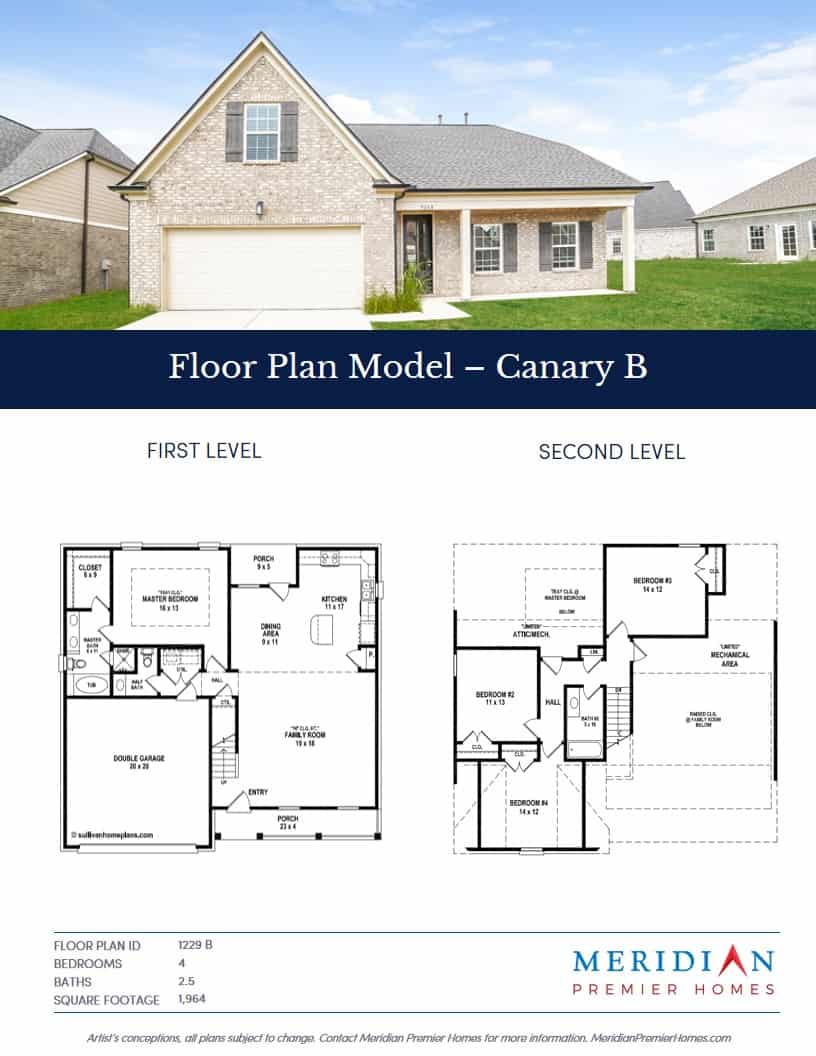
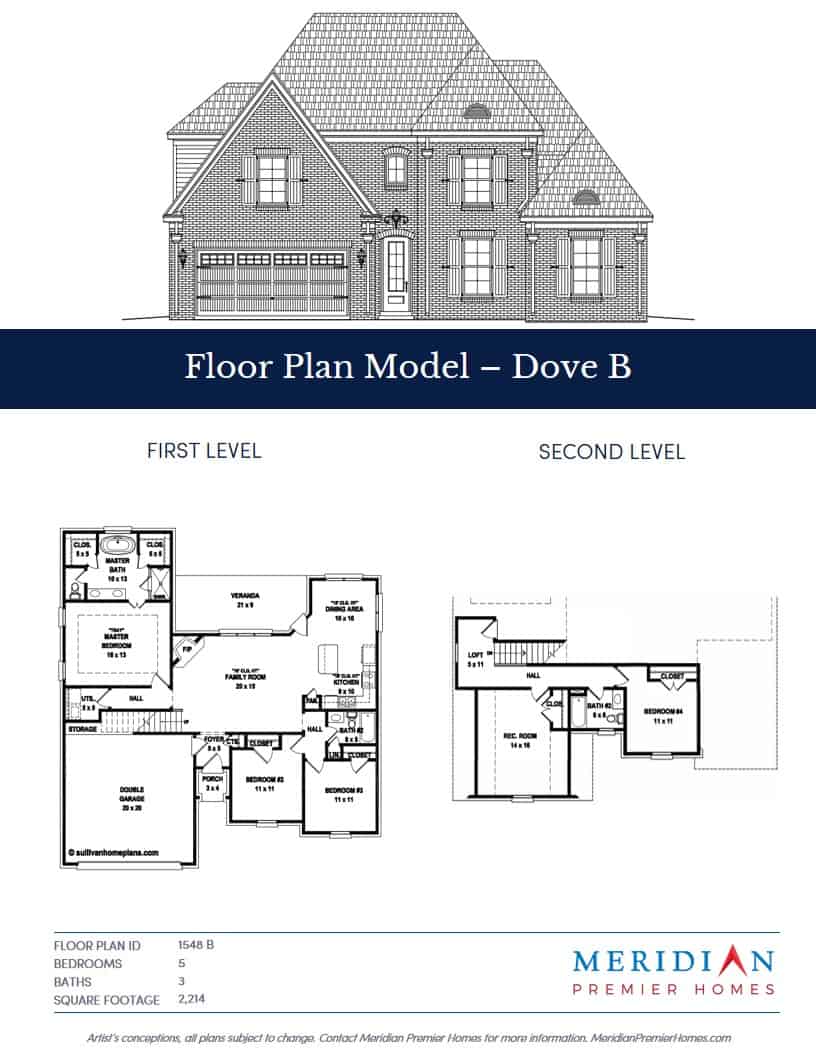
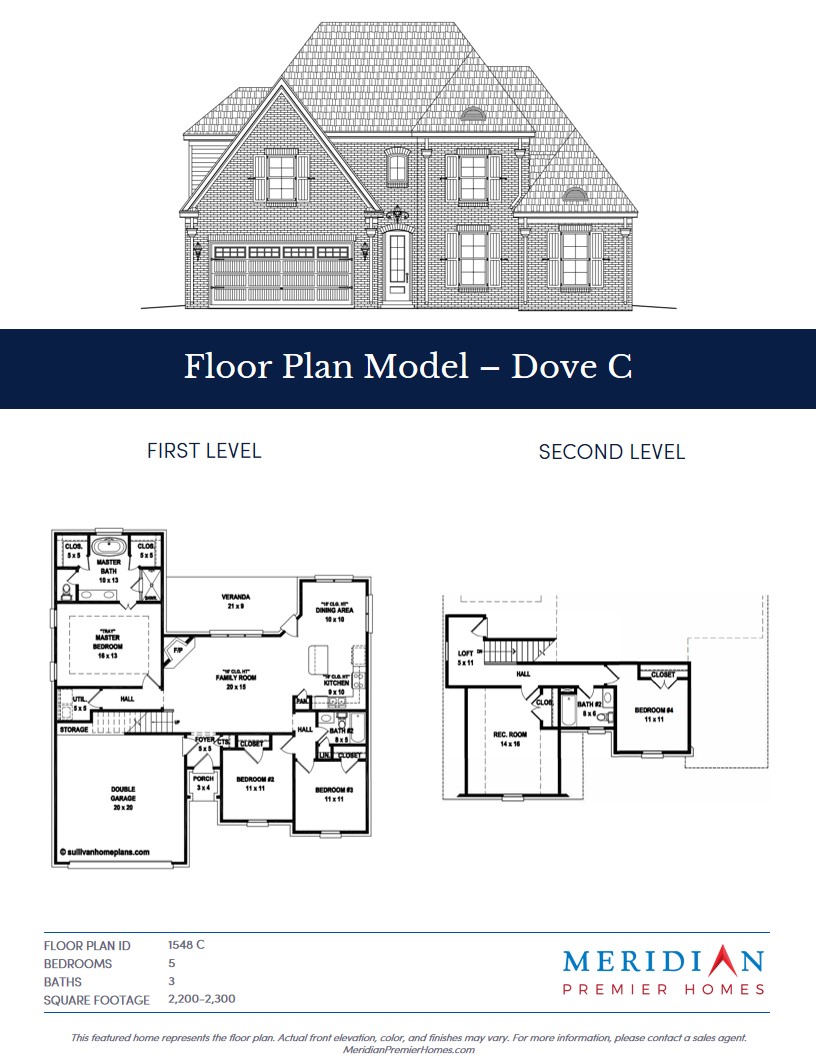
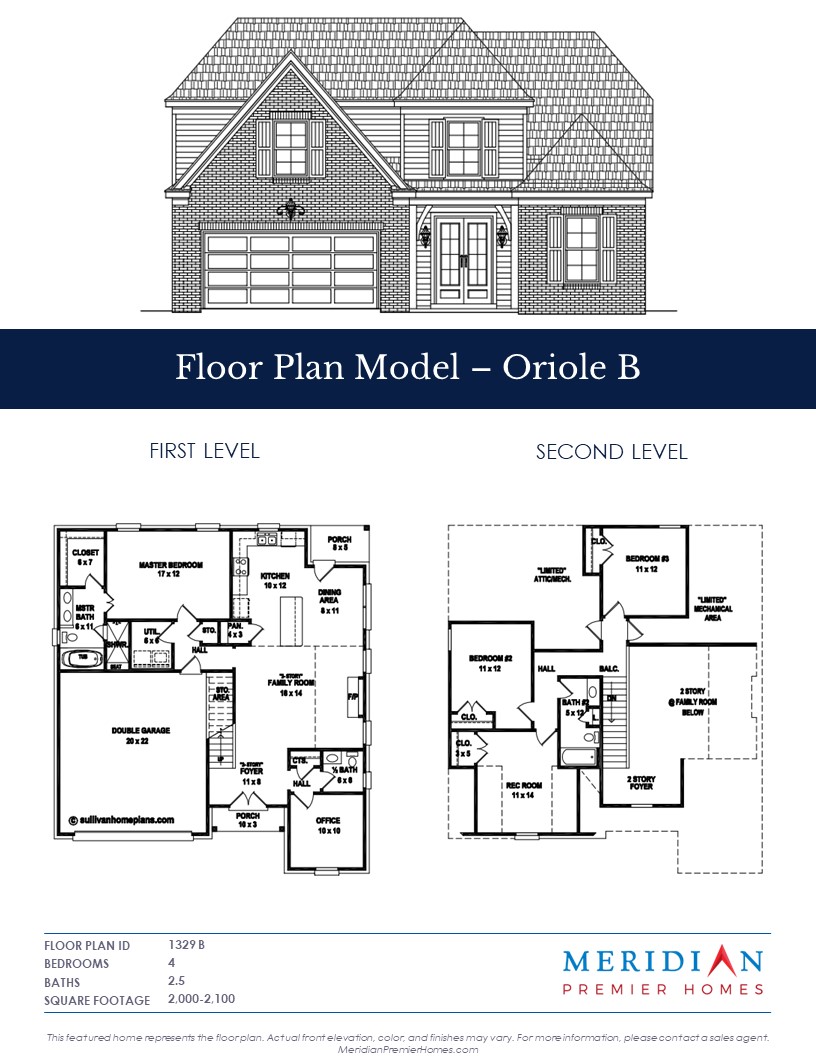
The housing market in Horn Lake remains affordable compared to neighboring suburbs, offering median home prices in the mid-$200,000 range and an attractive rent-to-price ratio that supports strong cash flow potential. Investors benefit from Mississippi’s competitive property tax rates and relatively low insurance costs, which together enhance net operating income. With moderate population growth, a diverse employment base, and stable housing inventory, Horn Lake provides a balanced environment for both yield and appreciation-focused investors. Newer single-family construction in well-located subdivisions like Baker Estates further improves the market profile, offering durable assets designed for longevity and efficient management.
Quality of life indicators further contribute to the city’s strength as a real estate market. Horn Lake maintains a system of parks and recreation facilities, including Latimer Lakes Park, which features athletic fields, walking trails, and public events throughout the year. Educational services are provided by DeSoto County Schools, one of Mississippi’s top-performing districts, and the city is home to Delta Technical College, which supports local workforce development. Retail centers, restaurants, healthcare facilities, and entertainment venues are abundant along Goodman Road and Interstate 55, providing convenience and accessibility that sustain local housing demand.
From an investor’s perspective, Horn Lake offers a compelling mix of economic stability, infrastructure access, and affordability. Its role within the greater Memphis logistics corridor ensures consistent rental demand, while its manageable operating costs and improving housing stock create opportunities for dependable returns. As the Memphis metro continues to attract business expansion and population growth, Horn Lake remains one of the most strategically positioned and resilient submarkets for long-term real estate investment.
redfin.com/city/8642/MS/Horn-Lake/housing-market
zillow.com/horn-lake-ms/home-values
datausa.io/profile/geo/horn-lake-ms
census.gov/quickfacts/hornlaketownmississippi
desotocountyms.gov/economic-development
latimerlakespark.com


 Builder Incentives
 Premium Property Access
 Advanced ROI Calculator
 The Investor Newsletter
 More!
More!