Olive Branch, Mississippi offers a compelling opportunity for investors seeking a market built on solid economic fundamentals. Located within the greater Memphis metropolitan area, Olive Branch benefits from an economy driven by logistics, manufacturing, and regional expansion—but at acquisition prices far below those in most major metros. The median household income in Olive Branch is nearly $100,000, well above the state average, reflecting a strong local tenant base with stable employment. Home values have shown consistent appreciation, with median prices in the low $400,000 range and per-square-foot pricing around $160 in 2025.
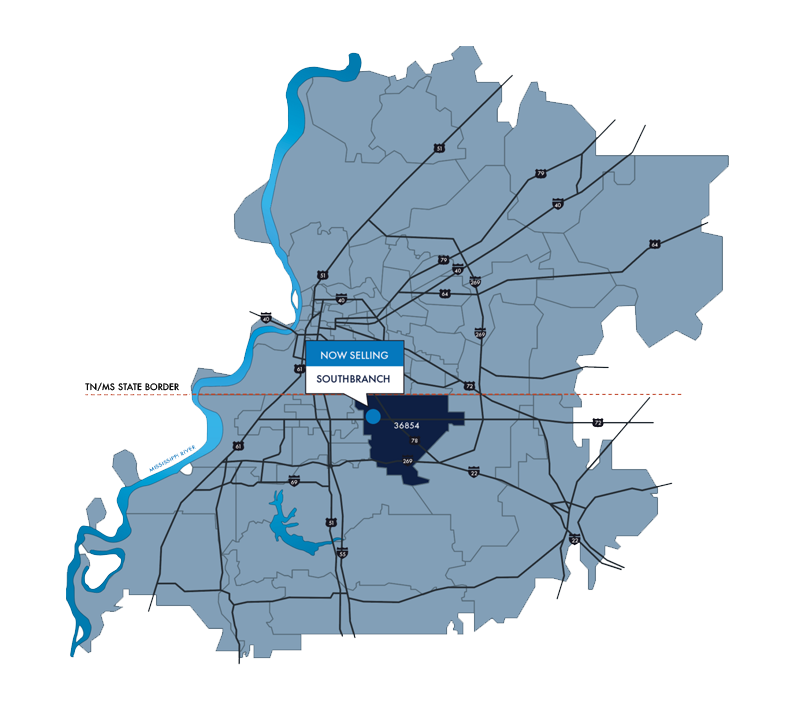
A key advantage for investors is Olive Branch’s access to regional employment and infrastructure. Situated just outside of Memphis, the city connects easily to major transportation corridors, including U.S. Route 78 and Goodman Road, and benefits from the presence of globally recognized employers such as FedEx, Nike, and Amazon. With over 80 distribution, manufacturing, and logistics companies operating in DeSoto County, the job base remains diverse and resilient, creating a consistent pipeline of working-class professionals seeking high-quality rental housing near employment centers.
Population growth continues steadily, with current estimates placing Olive Branch between 45,000 and 50,000 residents. The cost of living remains below the national average, while property taxes are comparatively low, helping investors achieve stronger net yields. Affordable entry prices, combined with rental demand supported by employment stability, create favorable conditions for both cash flow and long-term appreciation.
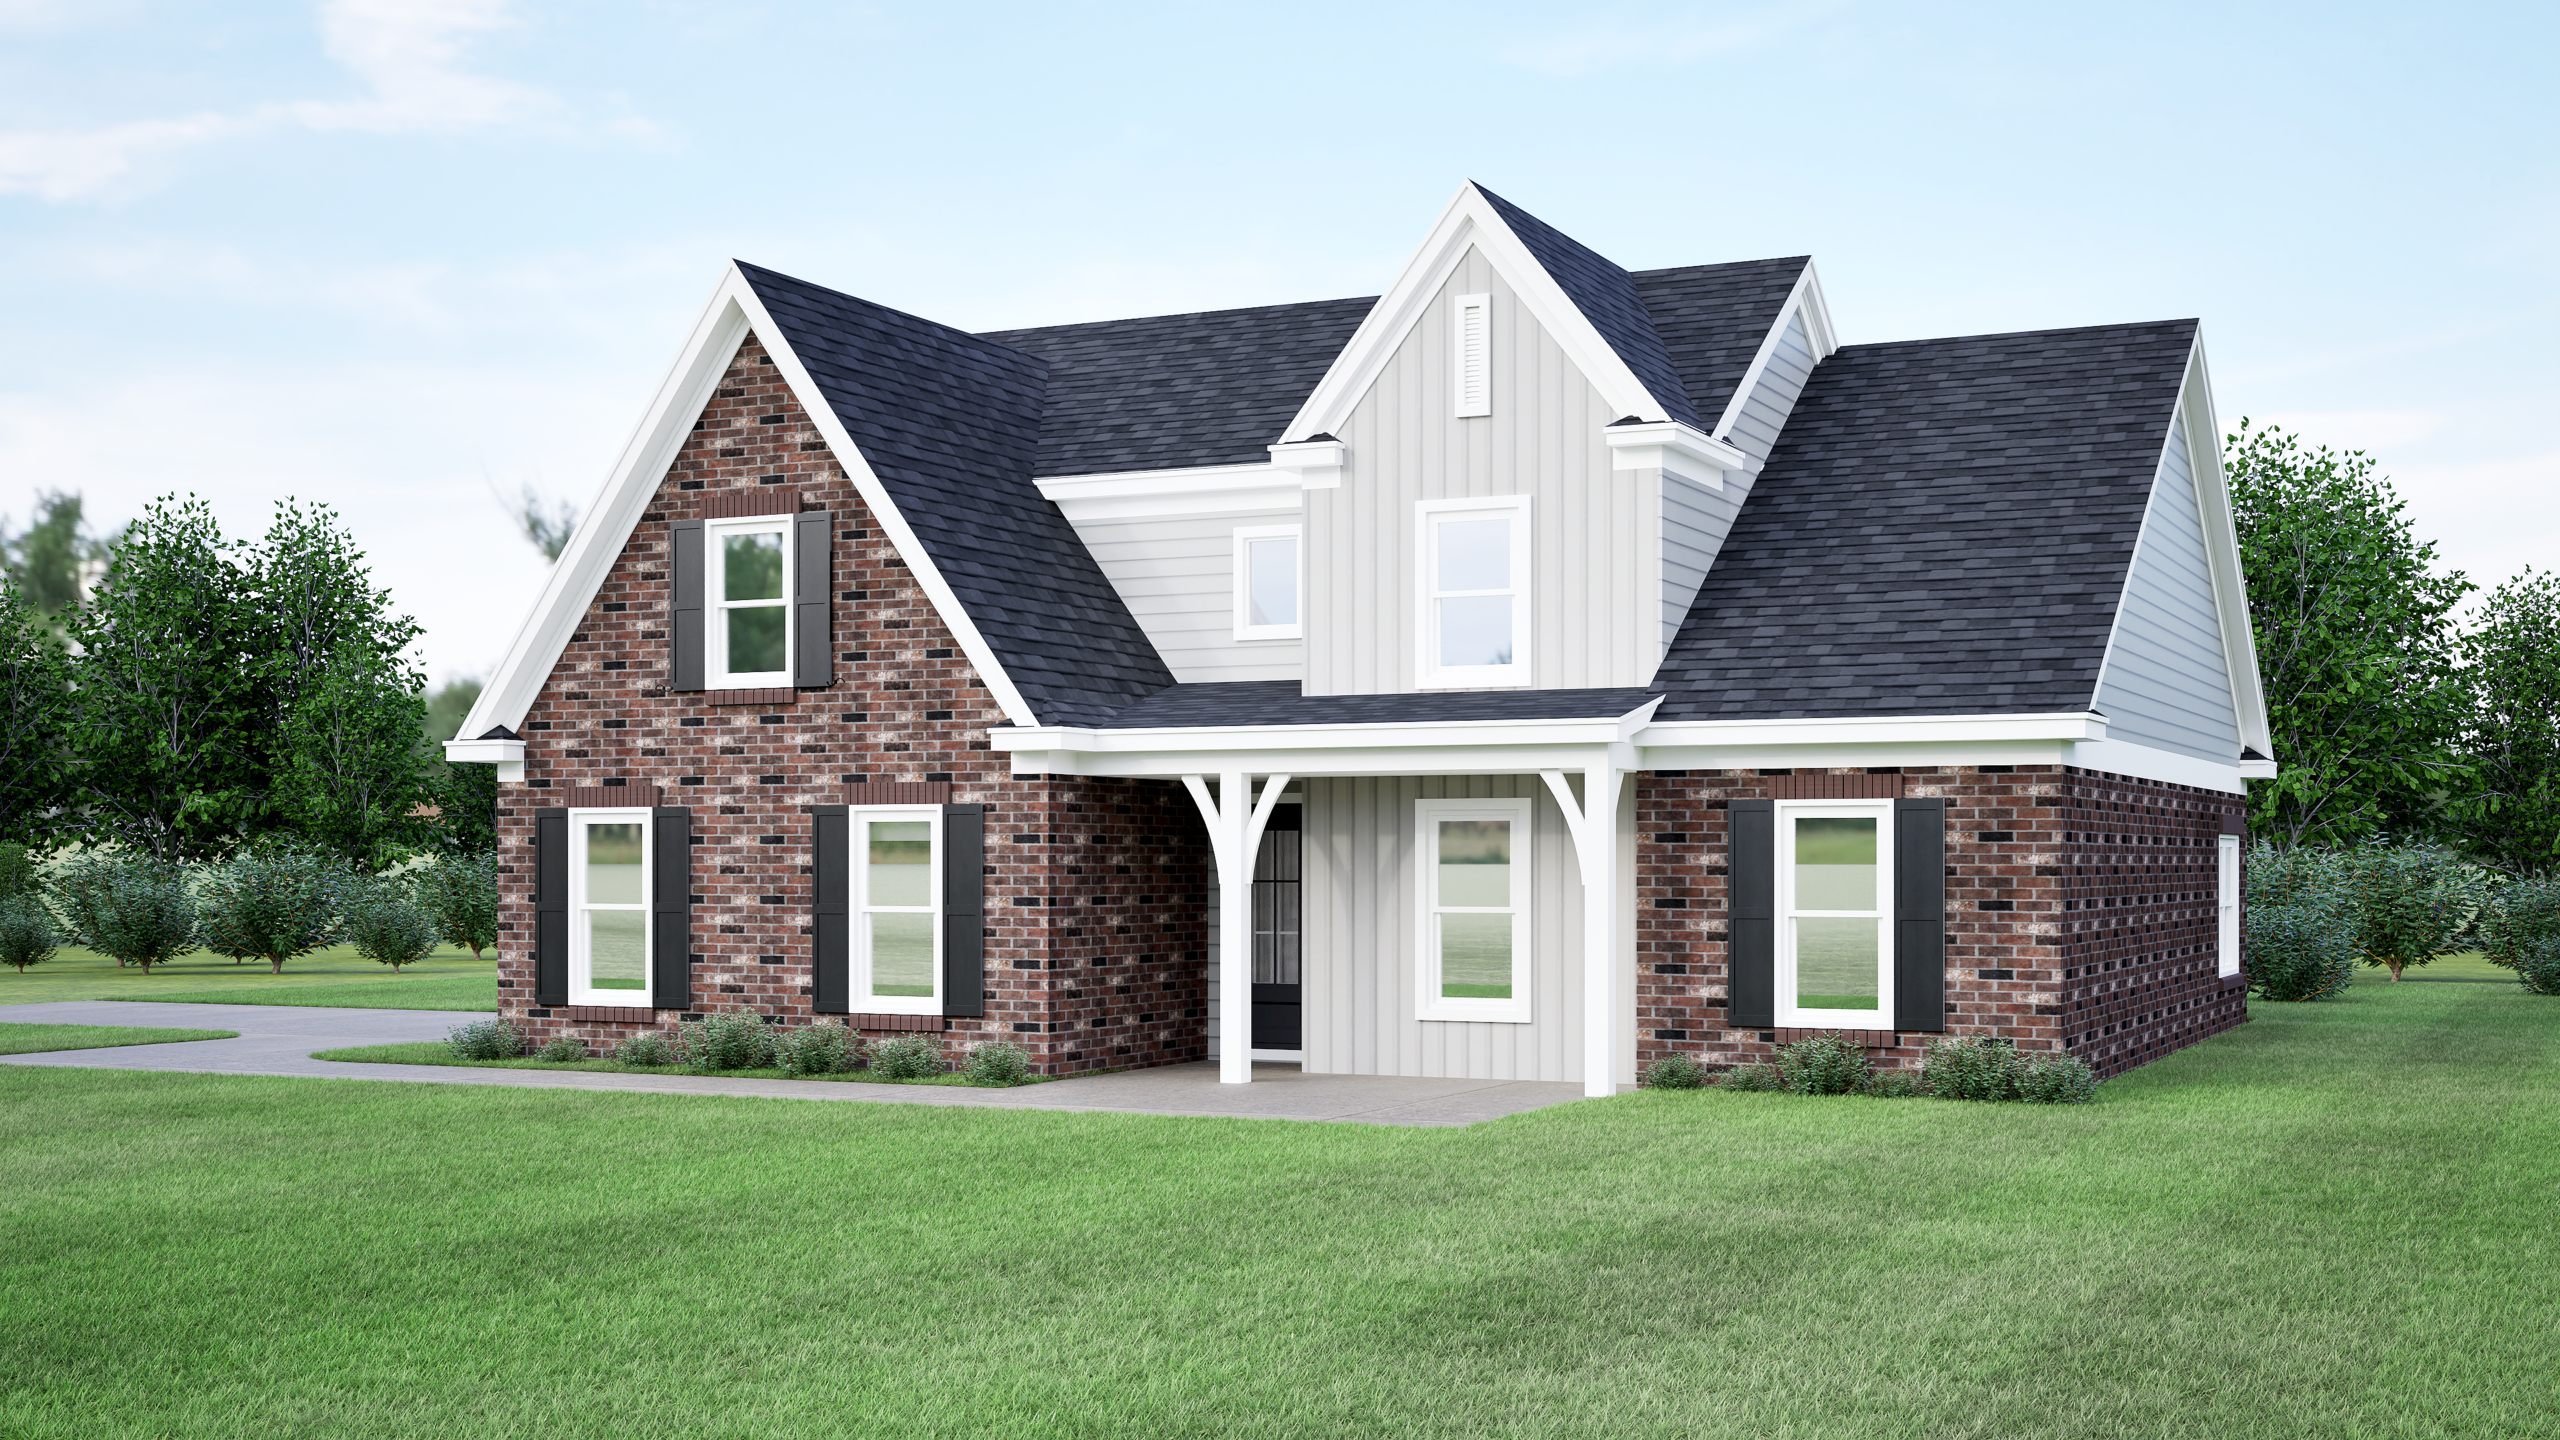
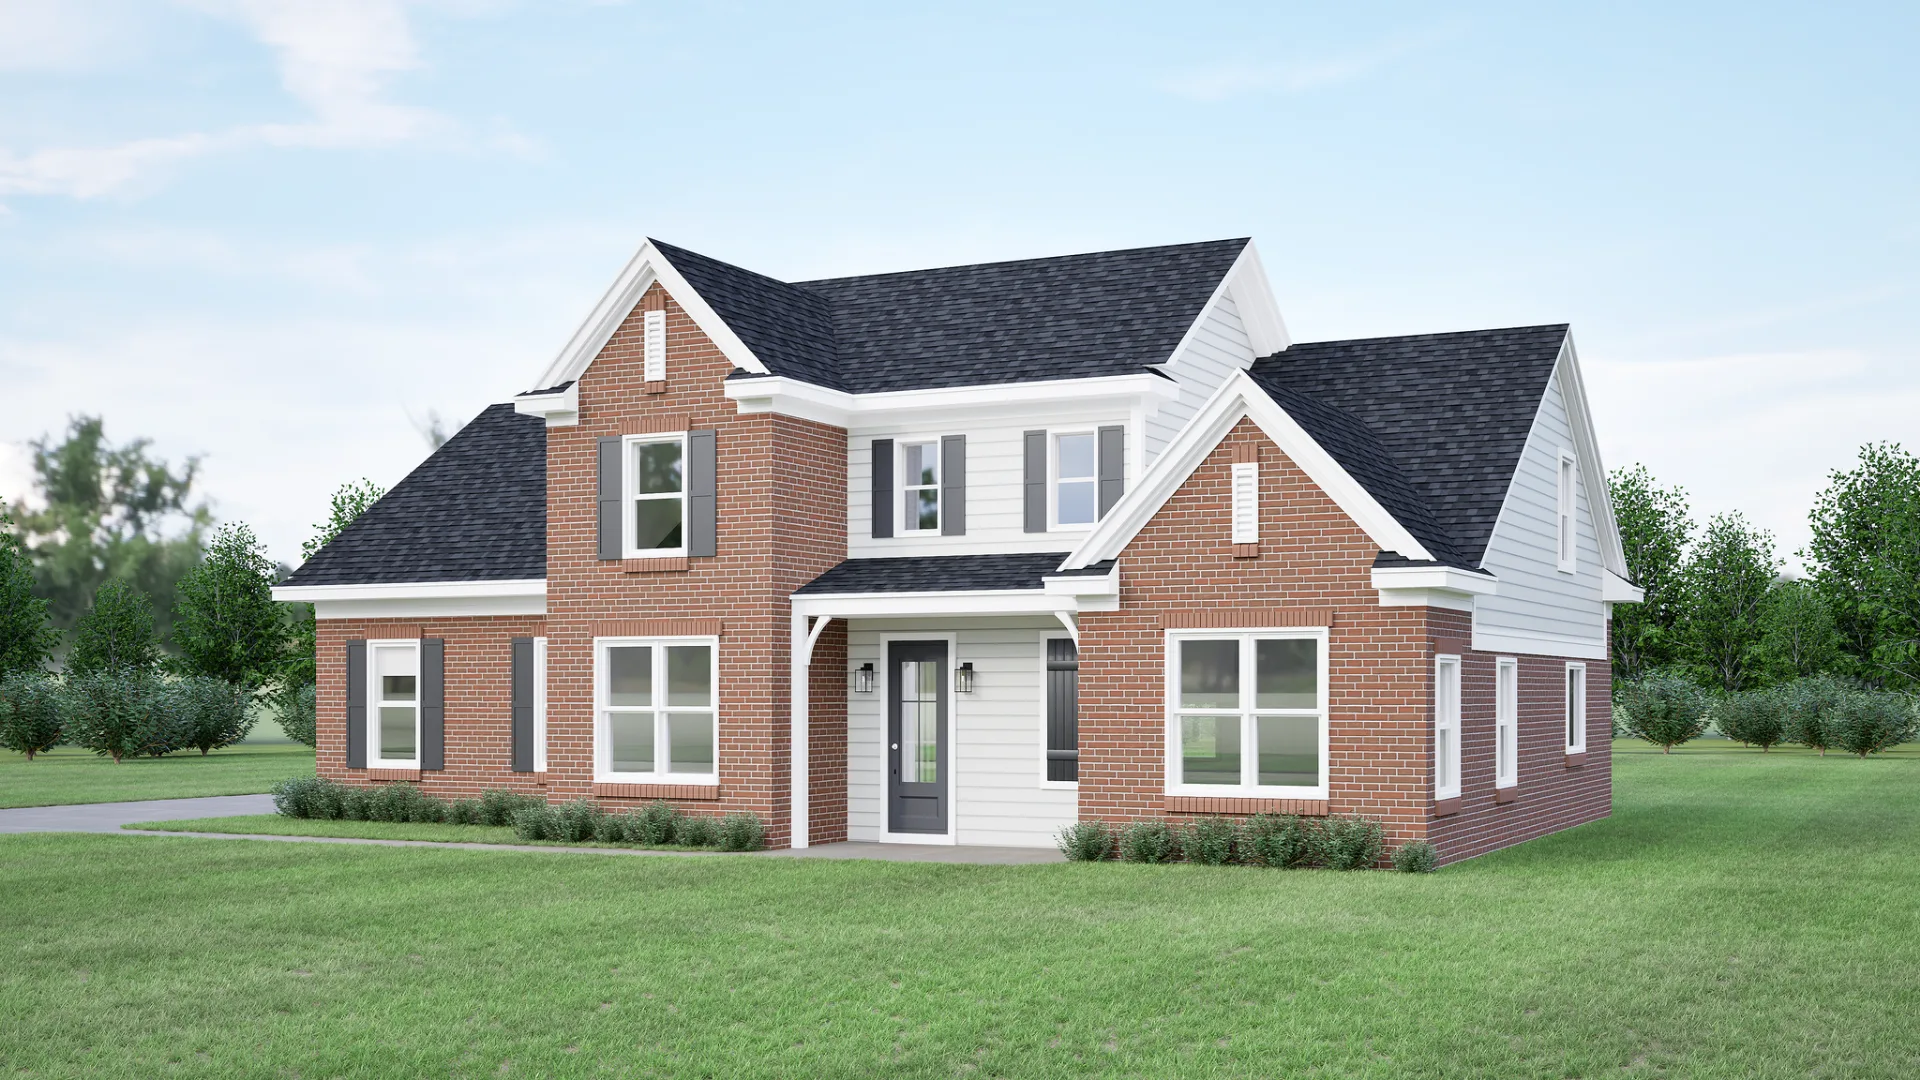
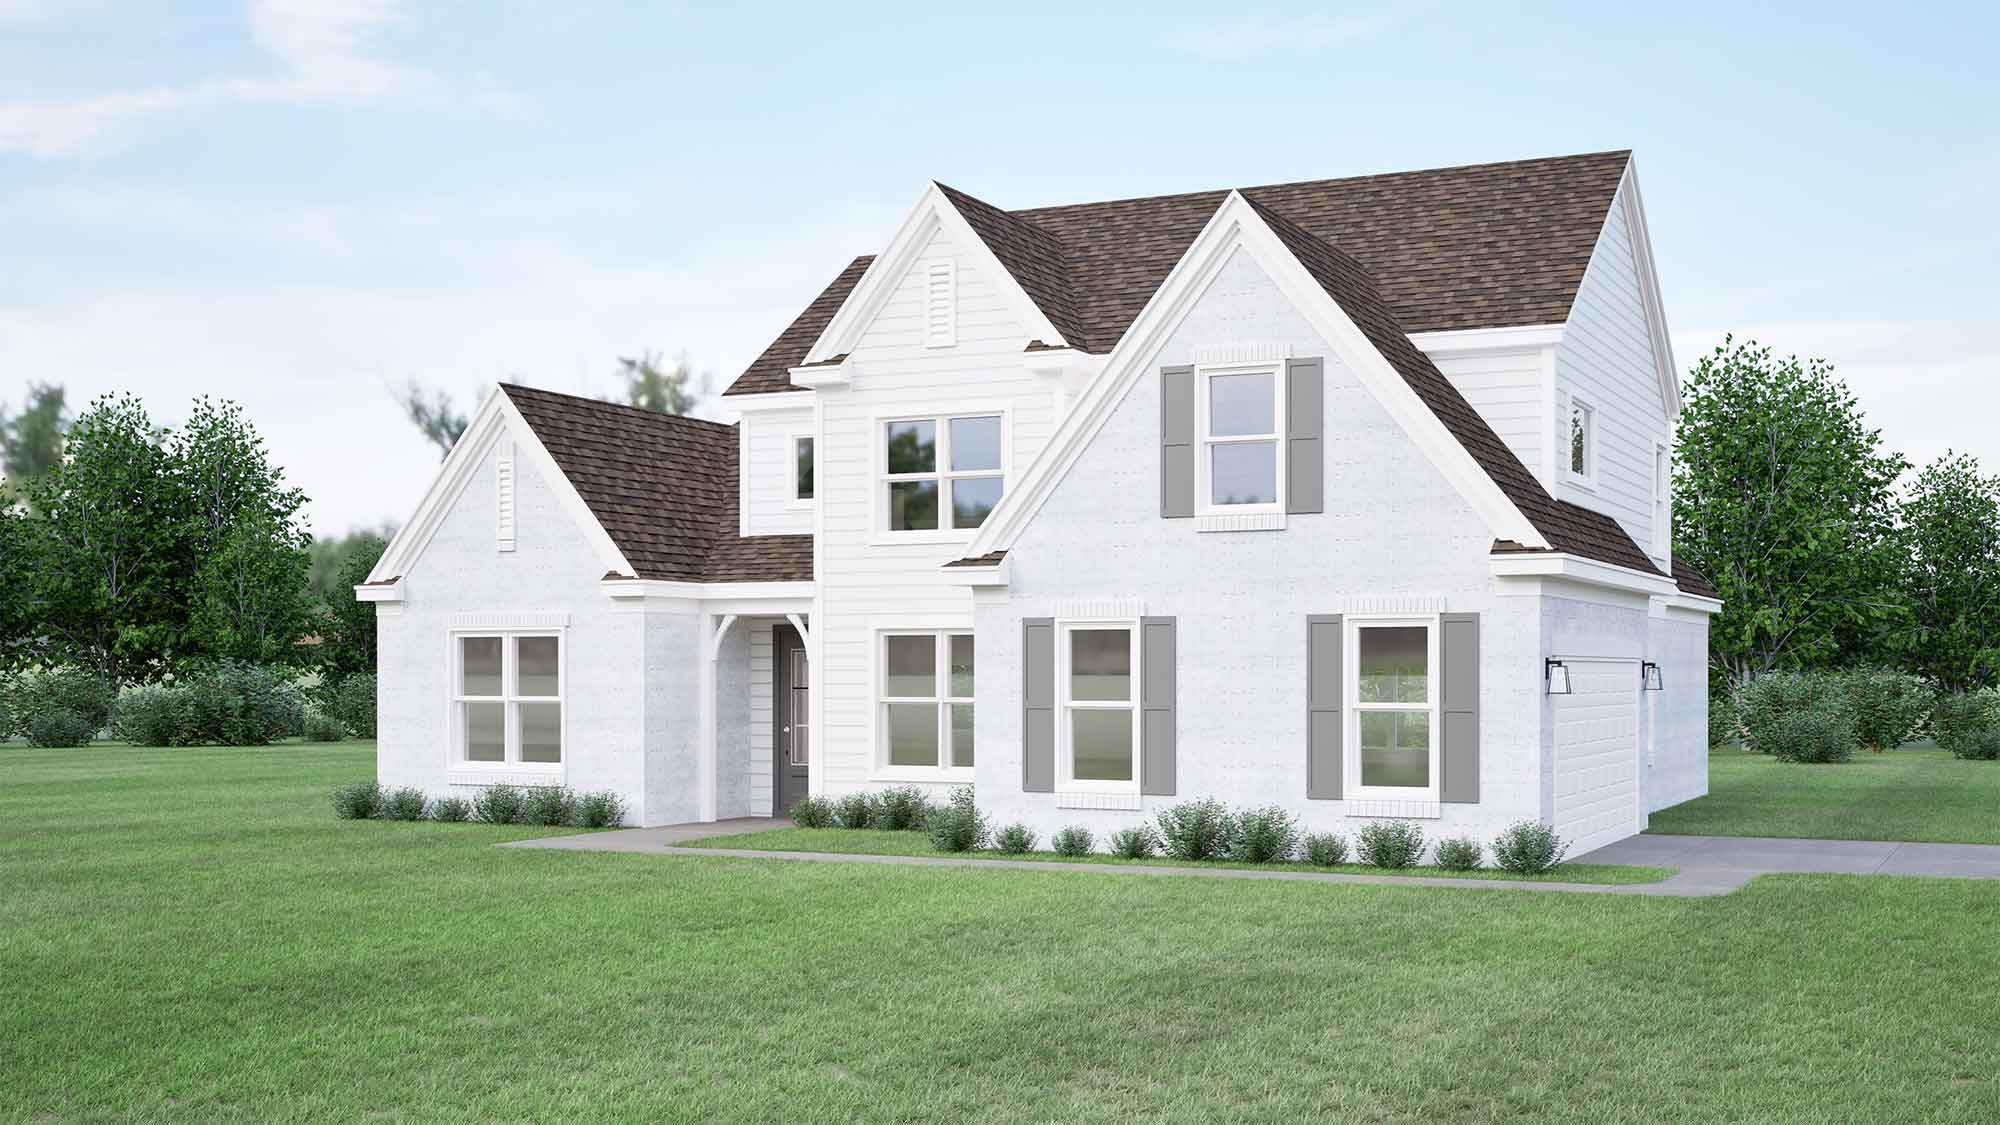
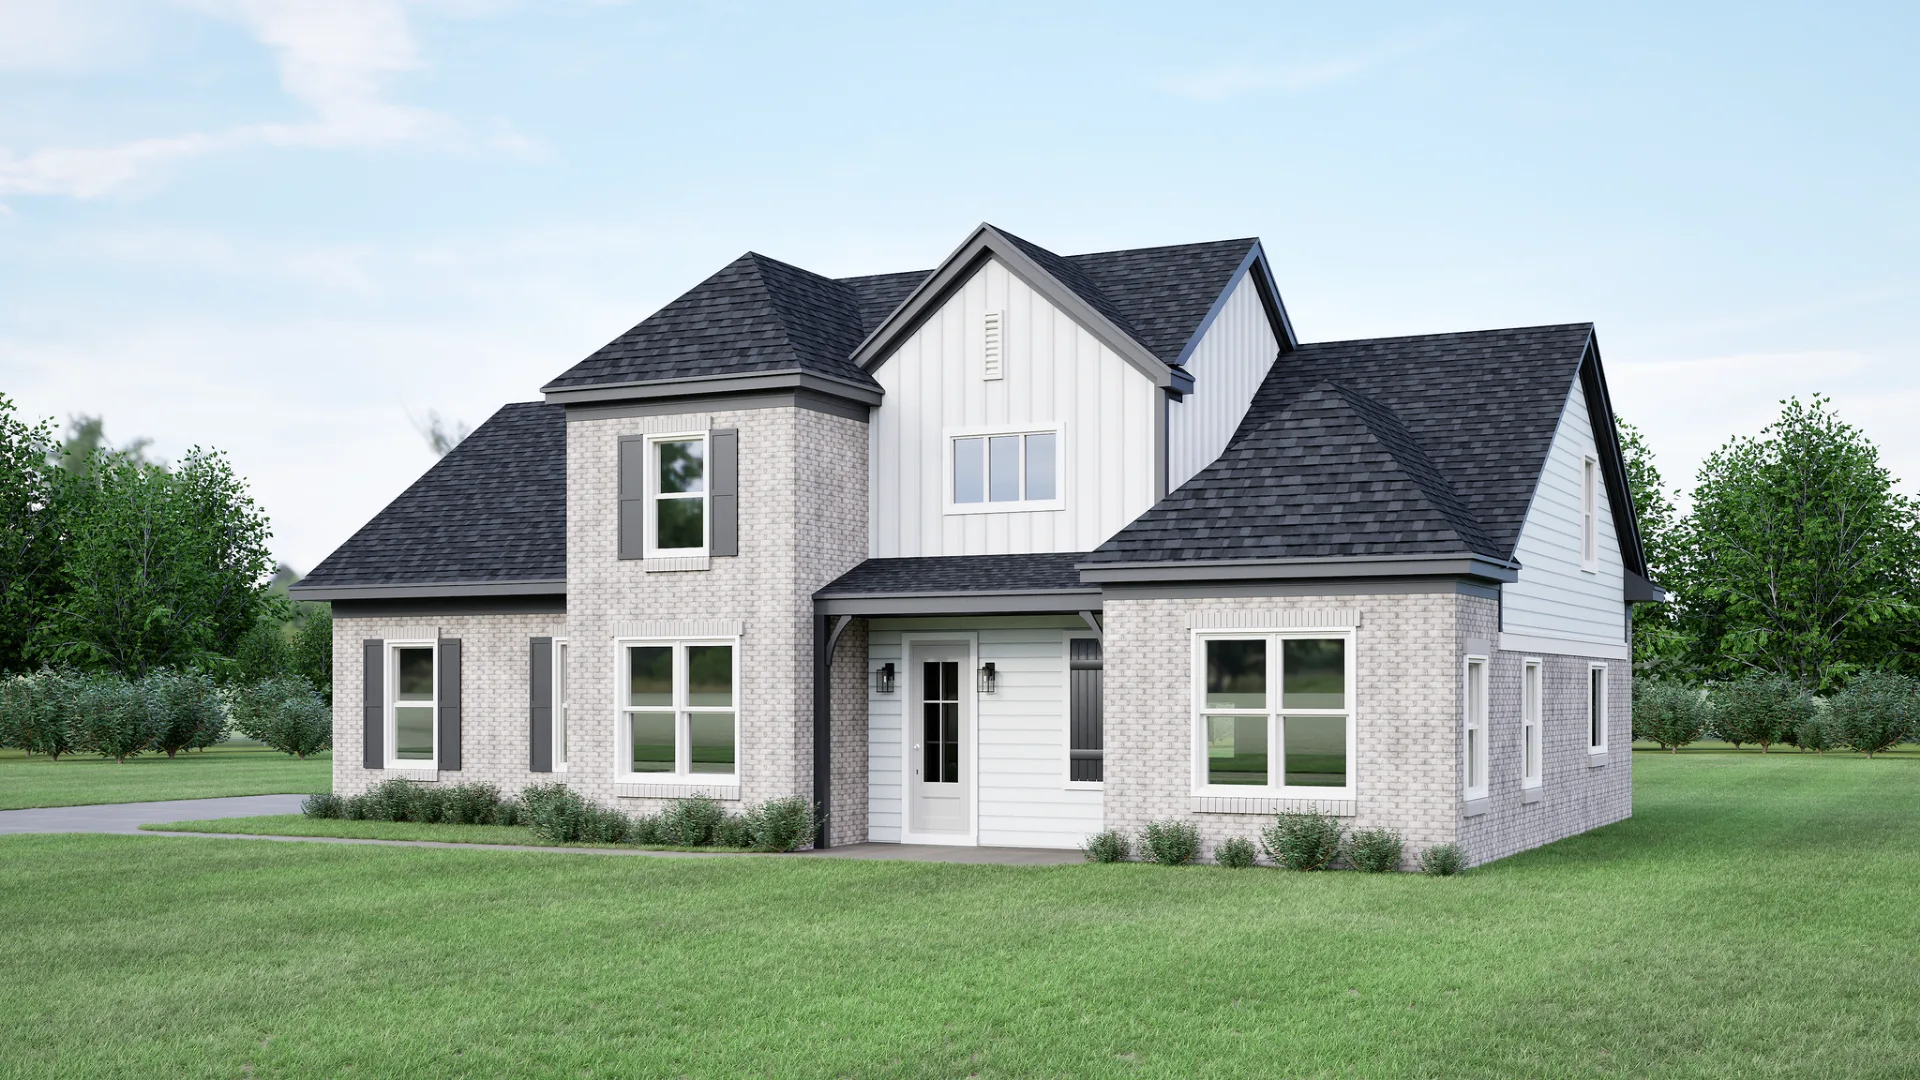
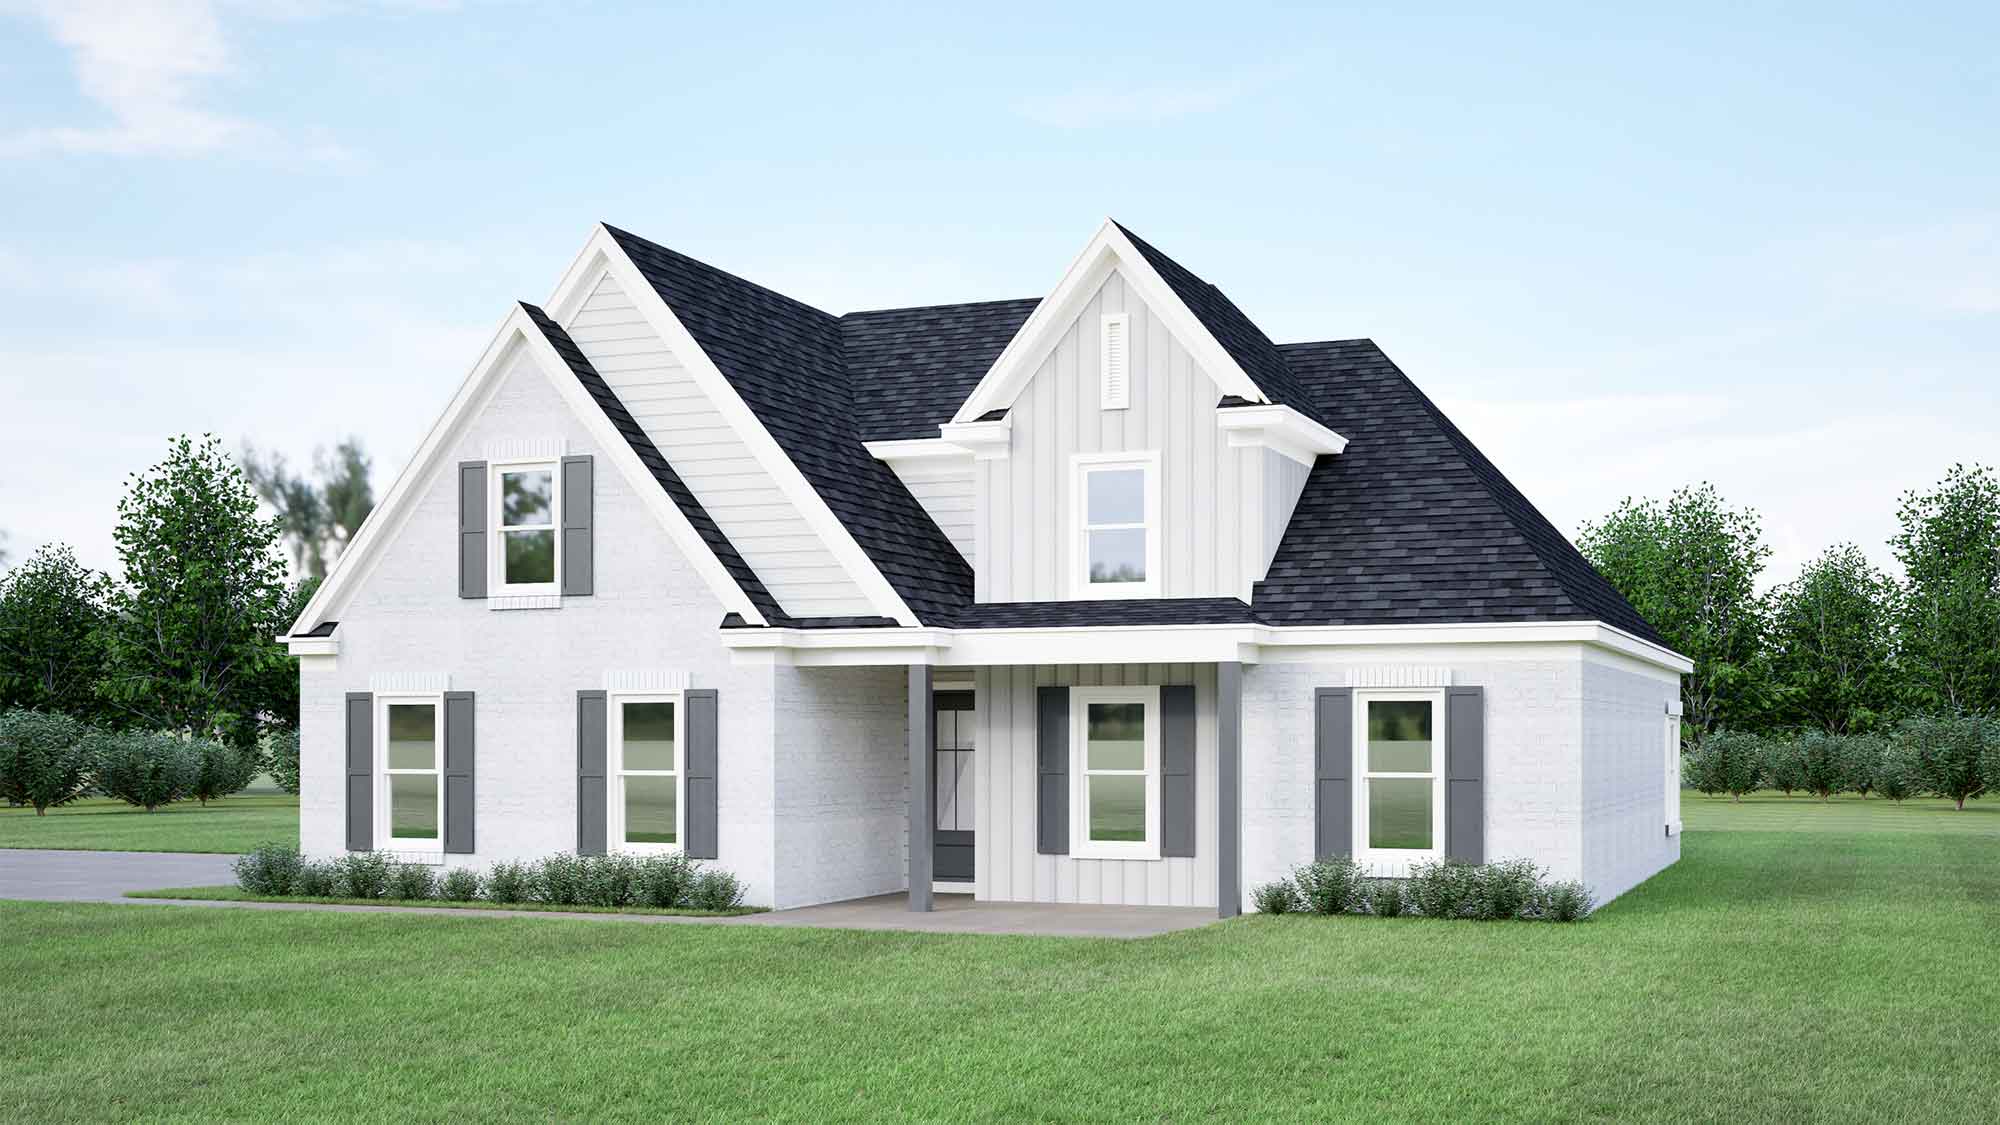
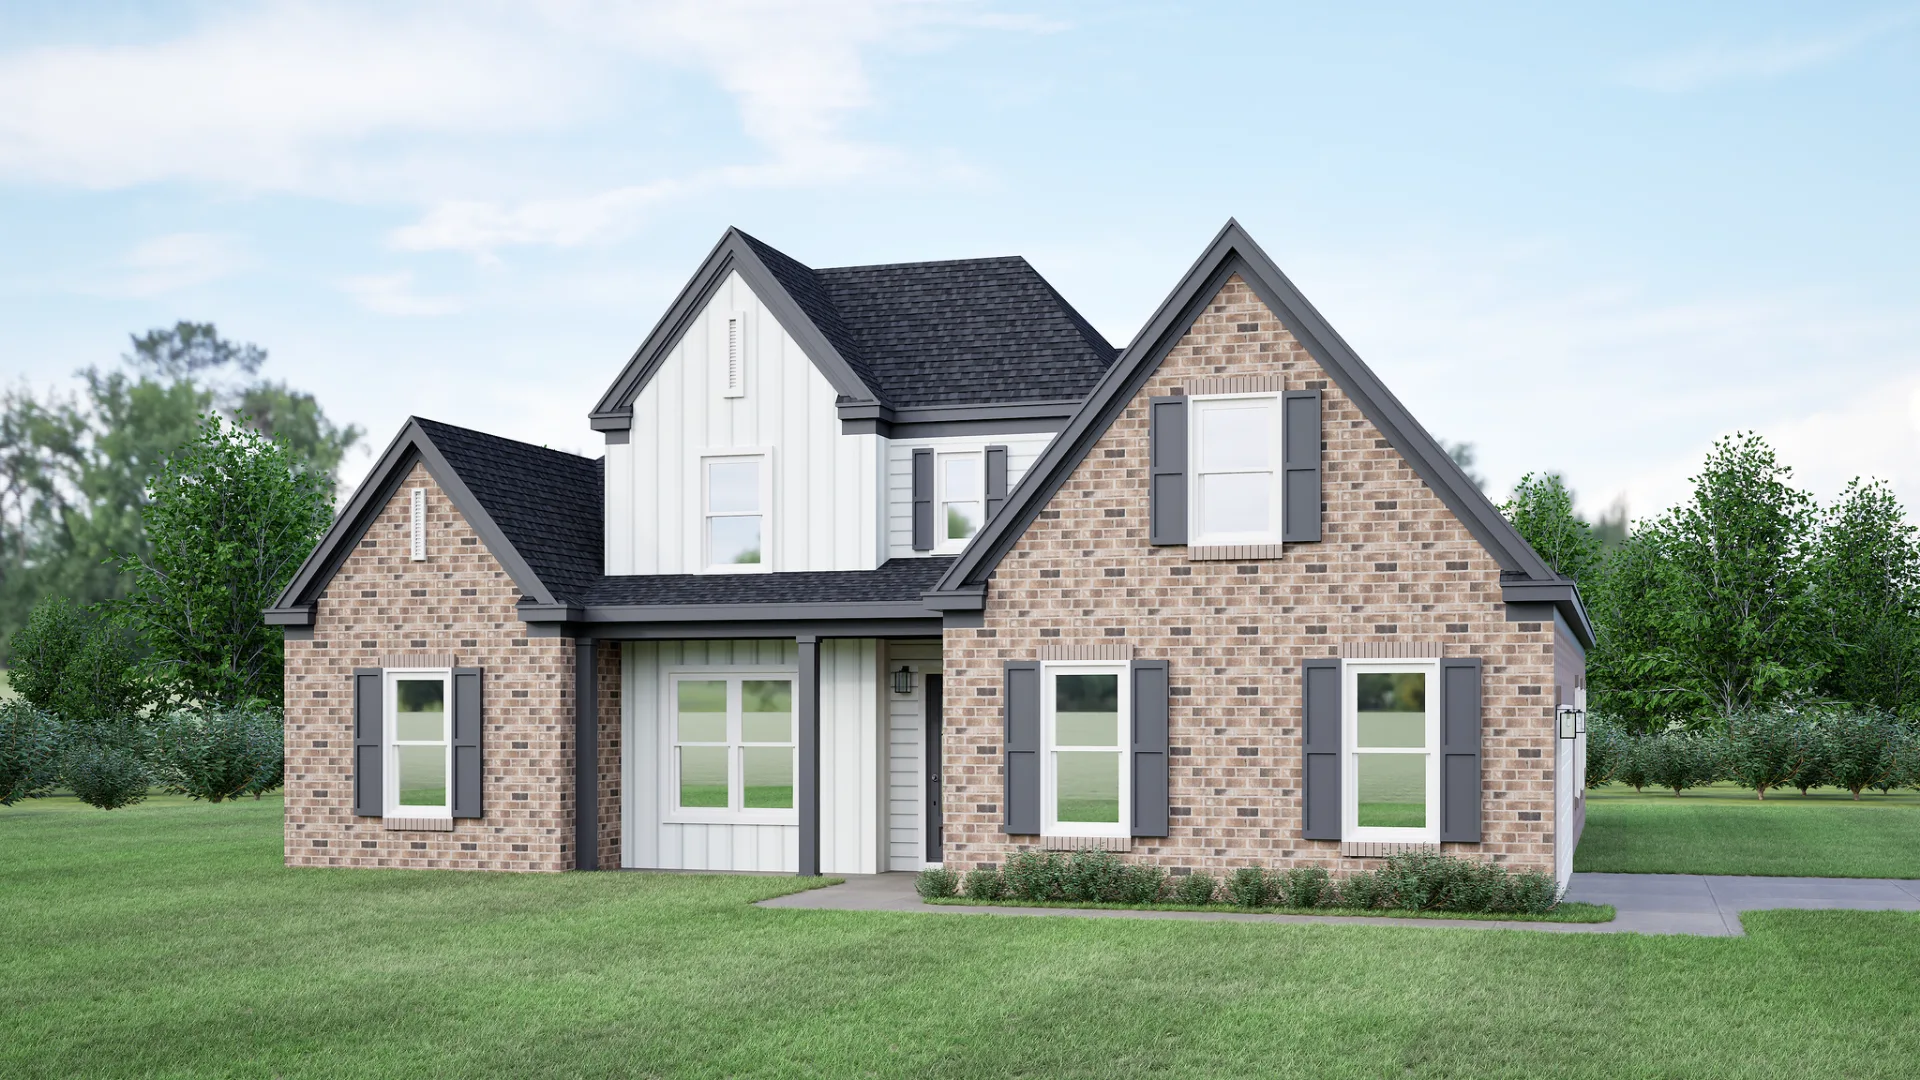
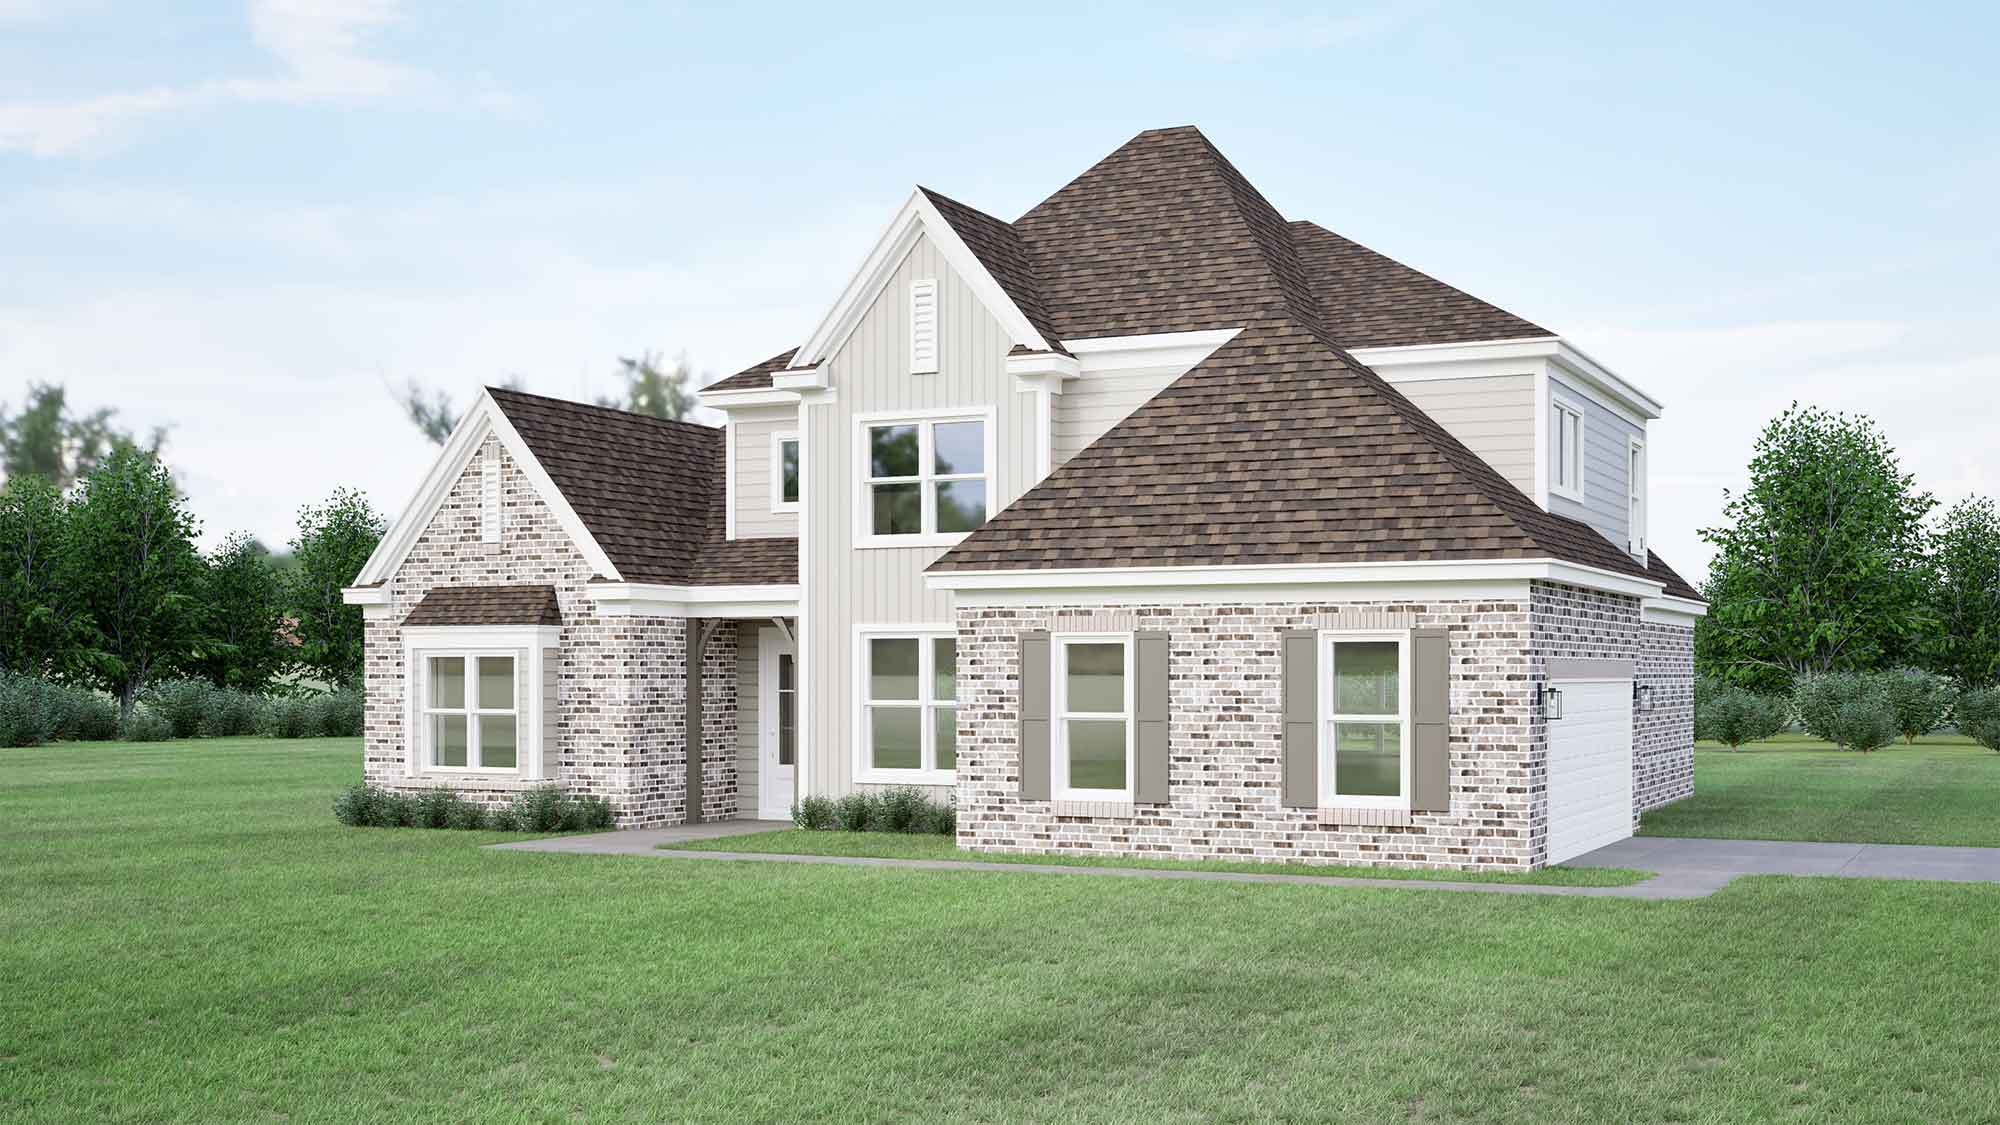
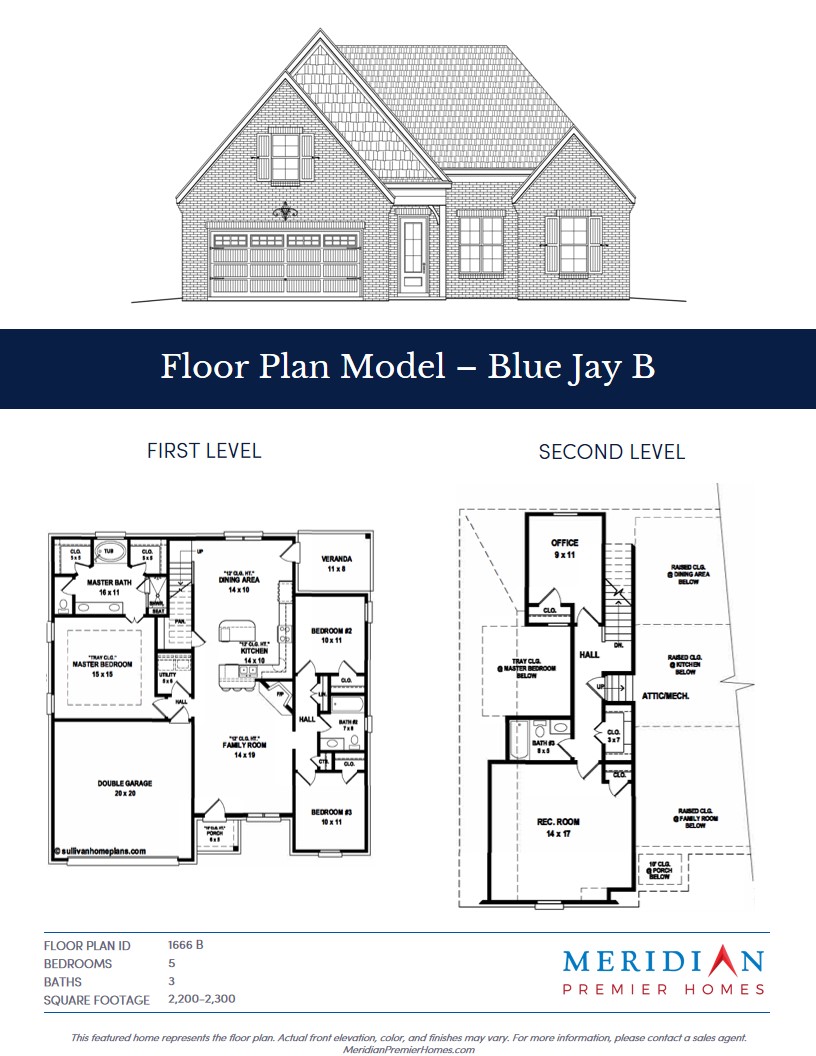
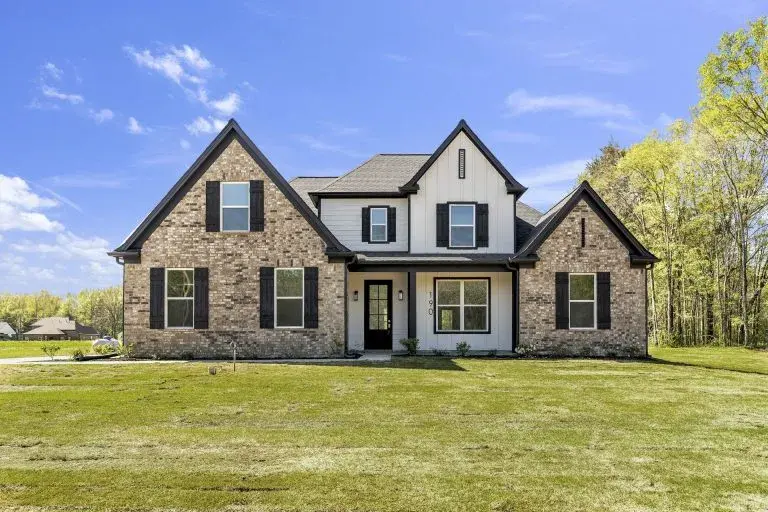
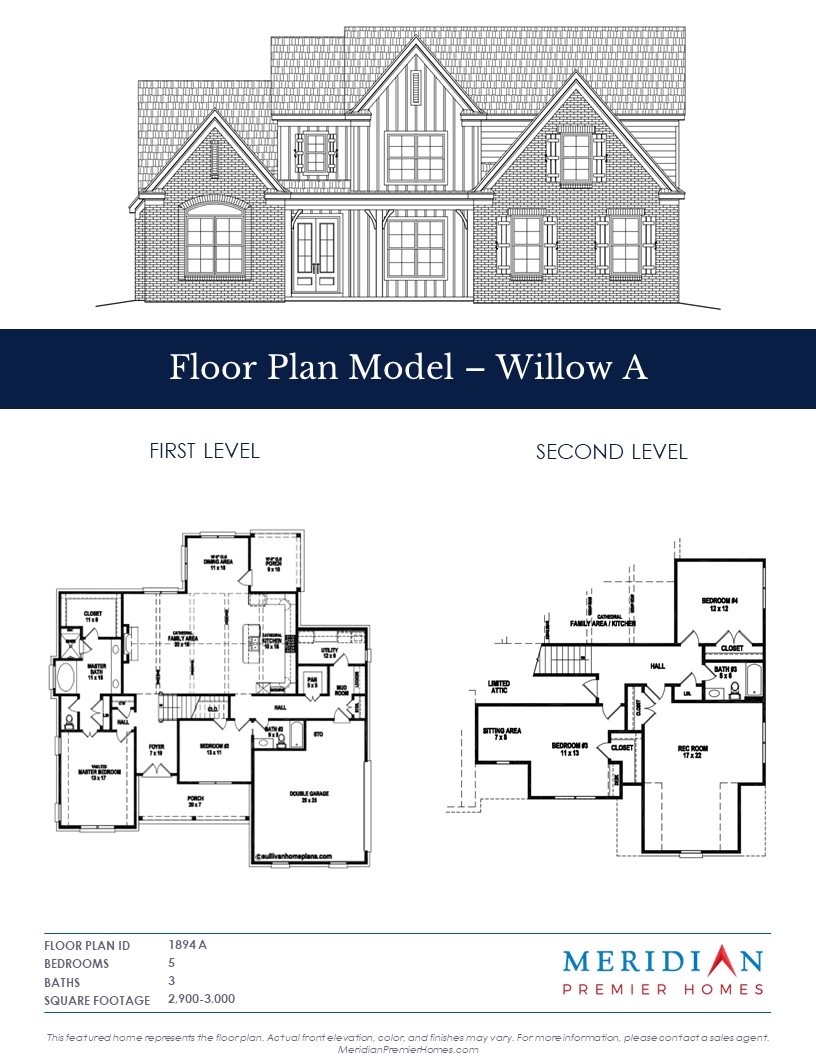
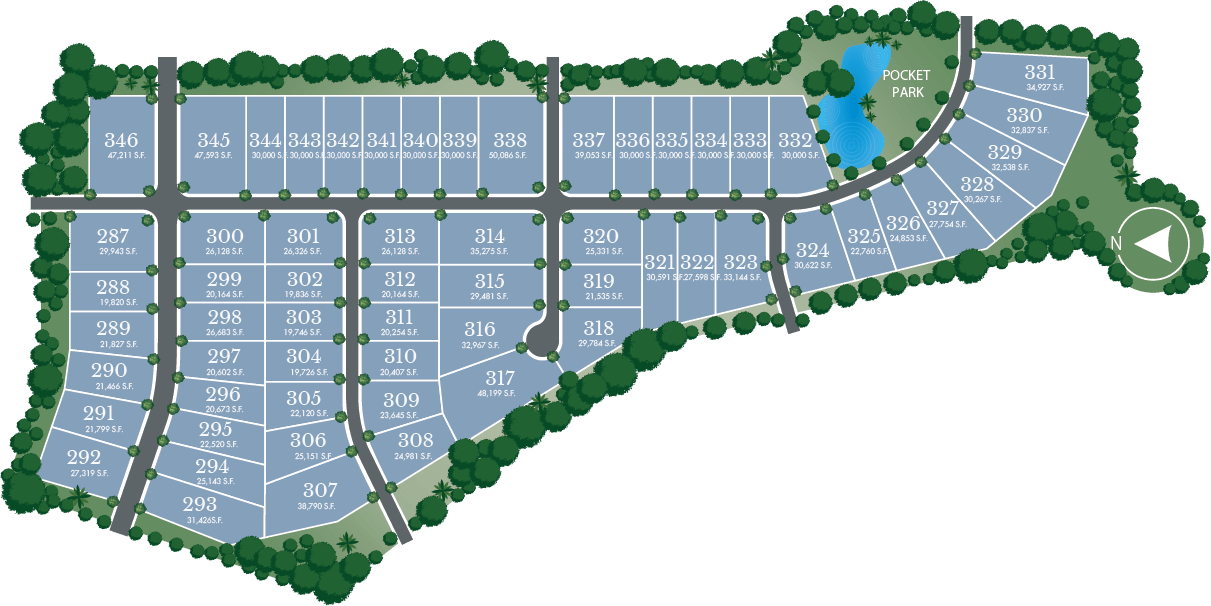
The local housing market offers modern communities, durable new construction, and well-maintained neighborhoods that appeal to long-term residents. Newer subdivisions are built with efficient materials, energy-saving systems, and layouts that accommodate today’s lifestyles—all features that reduce maintenance costs and attract quality tenants. With high owner-occupancy rates and stable leasing activity, Olive Branch provides investors with predictable performance and limited vacancy exposure.
Quality of life remains a defining characteristic of this market. Olive Branch is part of the DeSoto County School District, one of the highest-rated in the state, and features abundant green space, parks, and recreational areas. The city offers a balance of suburban comfort and urban convenience, with local shops, dining, and medical facilities such as Methodist Olive Branch Hospital nearby. While many U.S. suburbs are experiencing rising costs and regulatory pressures, Olive Branch maintains a balanced environment—affordable, efficient, and welcoming to investment.
From an investor’s perspective, Olive Branch represents a rare combination of affordability, rental stability, and growth potential within a thriving regional economy. The area’s proximity to Memphis, access to major employers, and solid economic and demographic trends position it as one of the most promising submarkets in the Memphis MSA for long-term single-family rental investments. For those seeking predictable returns and portfolio growth, Olive Branch stands out as a market where fundamentals—not speculation—drive performance.
Sources:
point2homes.com – Olive Branch demographics
realtor.com – Olive Branch housing market overview
datausa.io – Olive Branch economic and population data
homesnacks.com – Olive Branch cost of living and growth metrics

 Builder Incentives
 Premium Property Access
 Advanced ROI Calculator
 The Investor Newsletter
 More!
More!