Maintenance Rate (% of GOI):
2%
3%
4%
5%
5%
5%
5%
5%
5%
5%
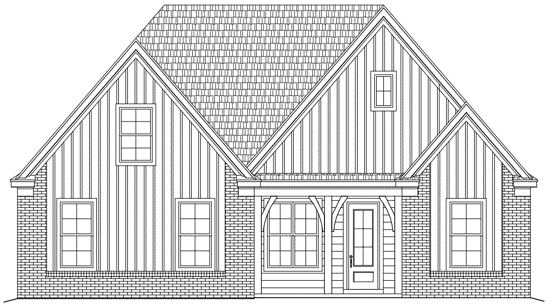
LVP flooring in common areas
Carpet in bedrooms
Ceramic tile in primary bathrooms
LVP flooring in bathrooms
Flat paint
Backsplashes in kitchen
Granite or quartz (upgrade) countertops
Cultured marble bathroom countertops
9′ or 10′ ceilings
Designer Lighting Package
Stainless steel dishwasher, microwave, gas range
Gas fireplace with modern mantle
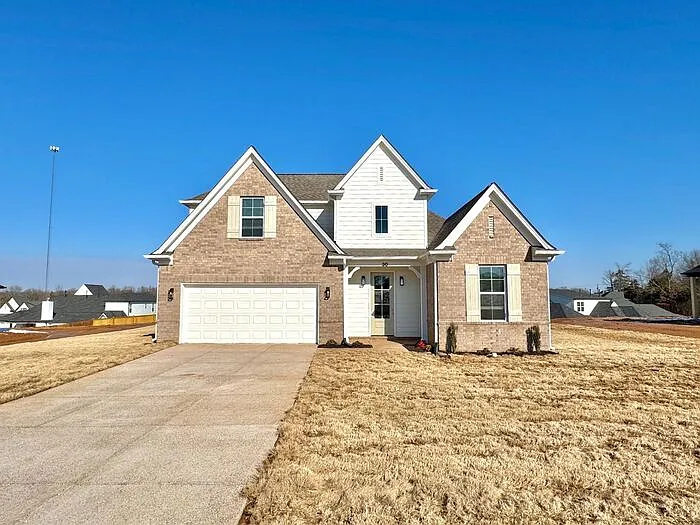
Buy this property for $394,995 and earn $2,650 per month in estimated rent.
All numbers are estimates for illustration only and not guaranteed. Actual performance, pricing, and rent may vary. This is not a commitment to sell or invest. Please consult your financial advisor. We expect the rent to be within $50 of the estimated rent. Meridian helps to protect the rental income for our investors through our rent warranty program.
Start earning rental income immediately. This turnkey property will be move-in ready for tenants the day you close escrow. Our local property management team will take care of everything for you.
This is a brand new home that has never been lived in. New construction homes typically have the highest overall ROI of any single-family rental property.
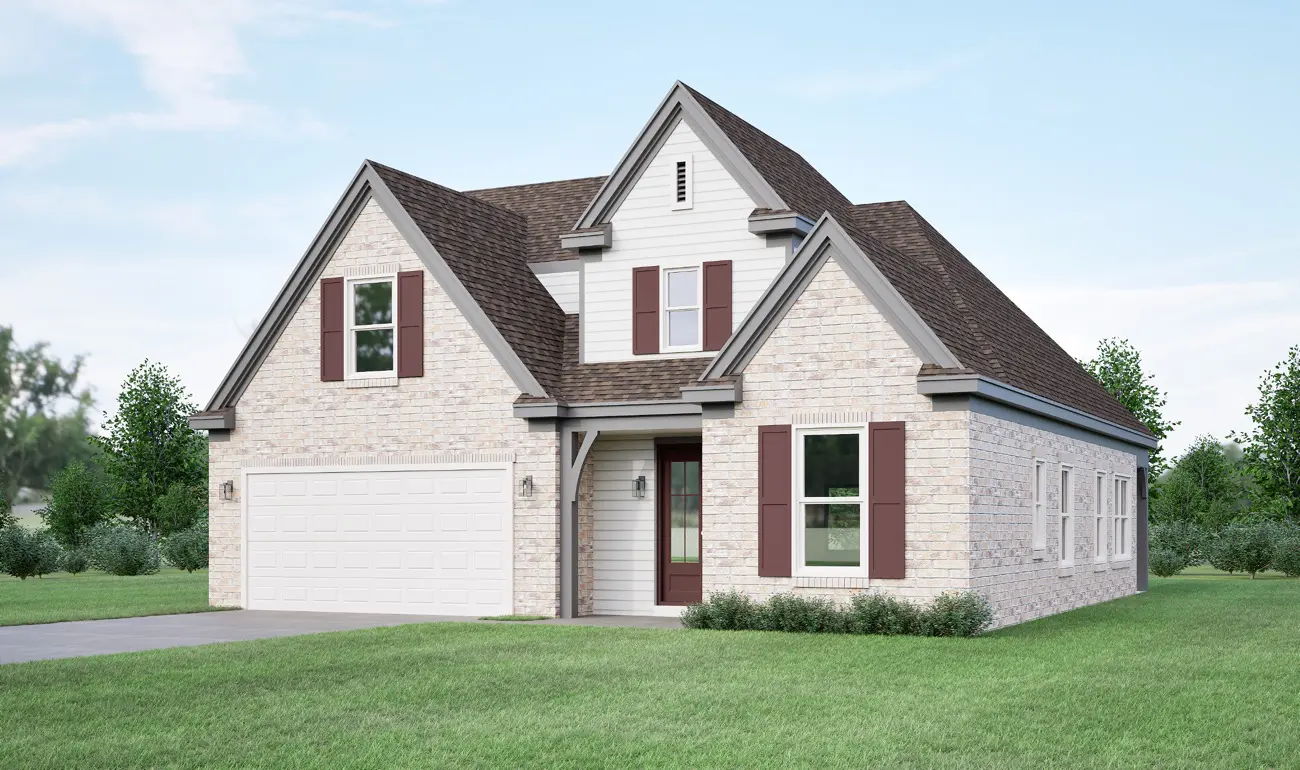
Meridian’s build-to-rent properties are designed to attract and retain long-term tenants. We use durable materials, modern amenities, and open floor plans
This property is rated Class A. It is a top-tier property in a desirable neighborhood, featuring premium construction, modern finishes, and strong rental demand—ideal for stable appreciation and high-quality tenants.
Buy this property for $394,995 and earn $2,650 per month in estimated rent.
All numbers are estimates for illustration only and not guaranteed. Actual performance, pricing, and rent may vary. This is not a commitment to sell or invest. Please consult your financial advisor. We expect the rent to be within $50 of the estimated rent. Meridian helps to protect the rental income for our investors through our rent warranty program.

Connect with a Meridian investment advisor to ask questions, evaluate the numbers, and explore how this property fits your goals. Theres no pressure — just expert guidance.
Create a free investor account for premium website access and exclusive benefits.
"*" indicates required fields
Already have an account? Sign in.
Create a free investor account for premium website access and exclusive benefits.
New to our website? Create a free account.
"*" indicates required fields