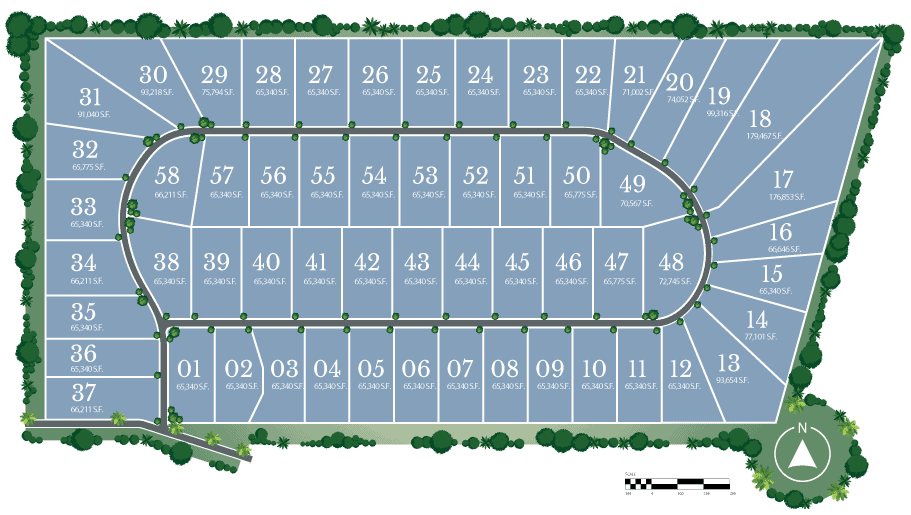
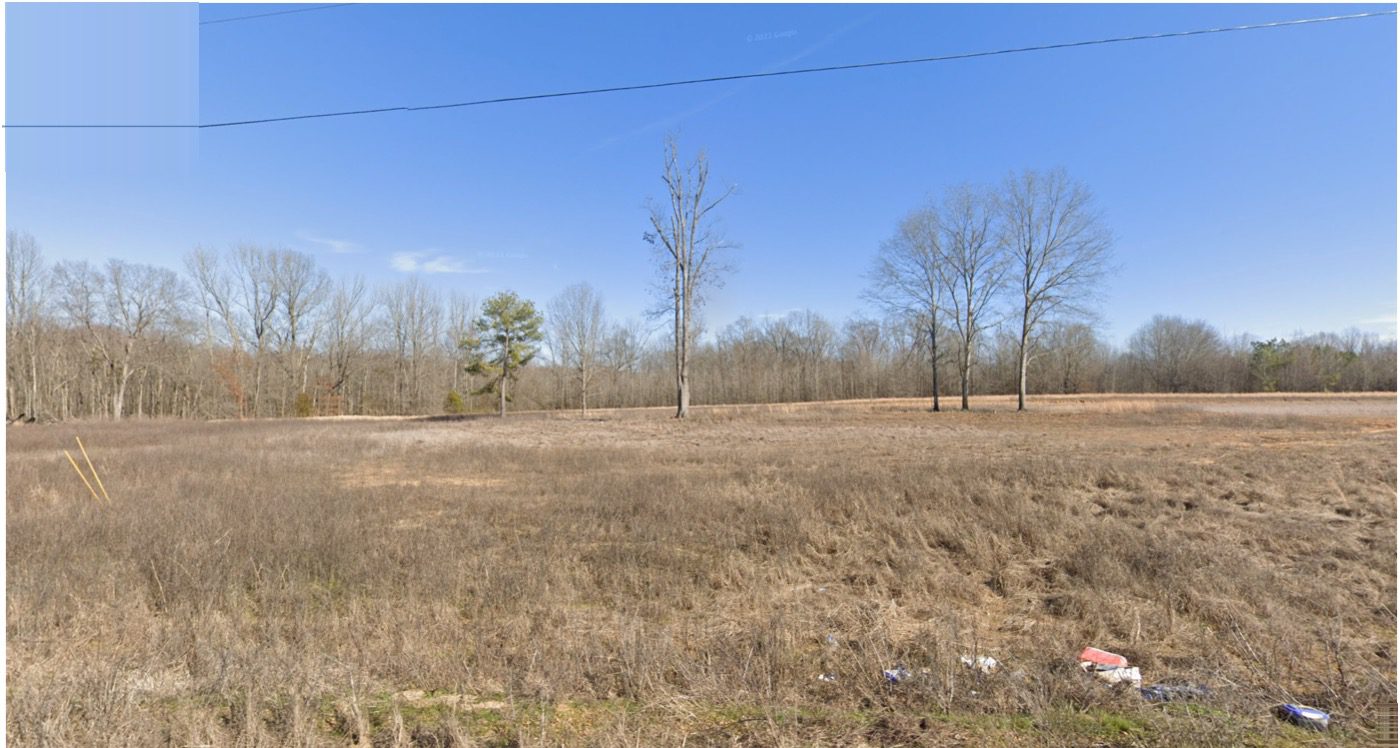
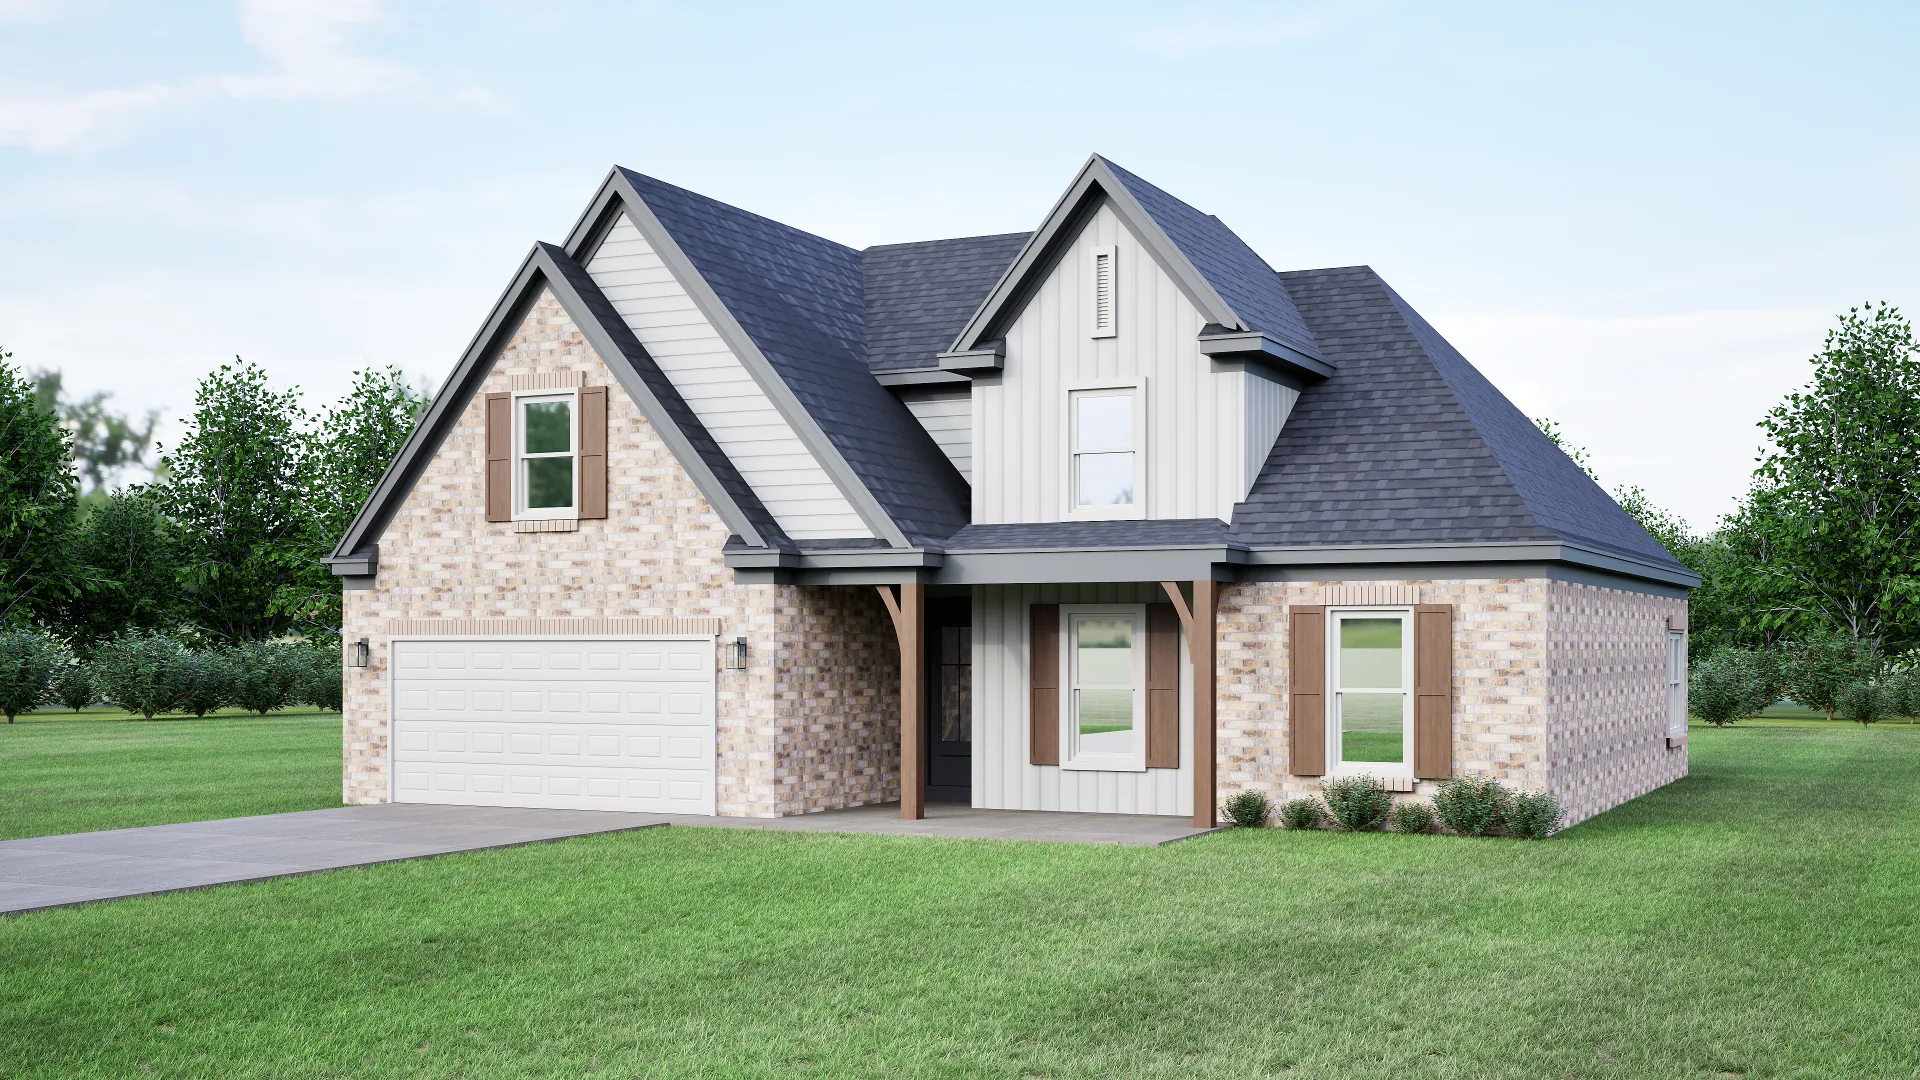
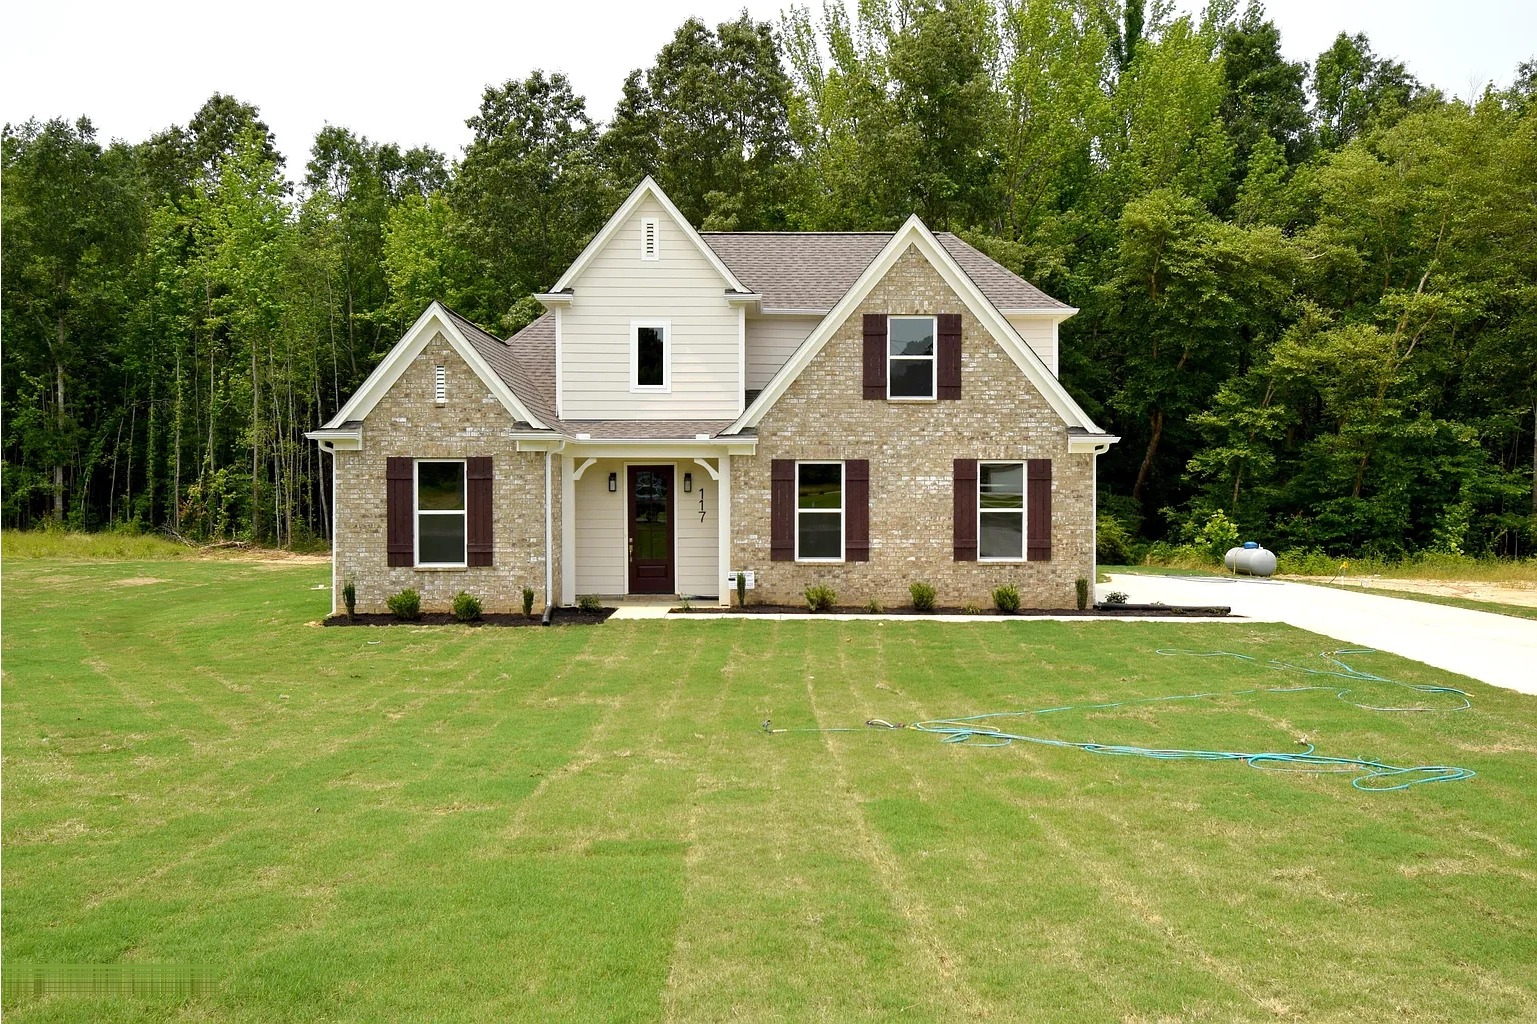
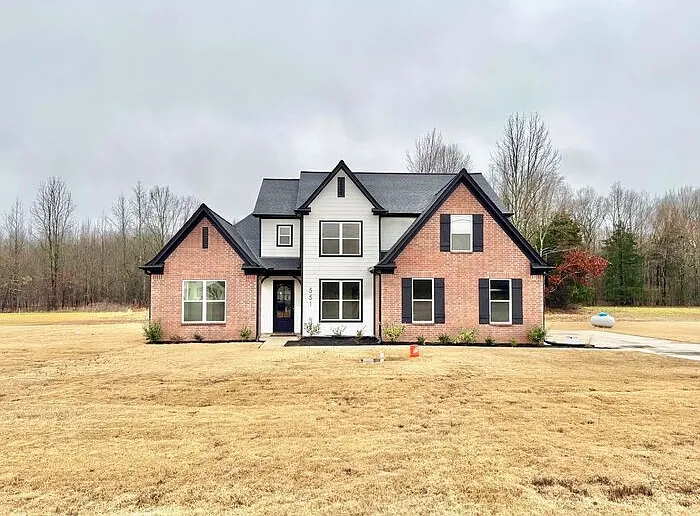
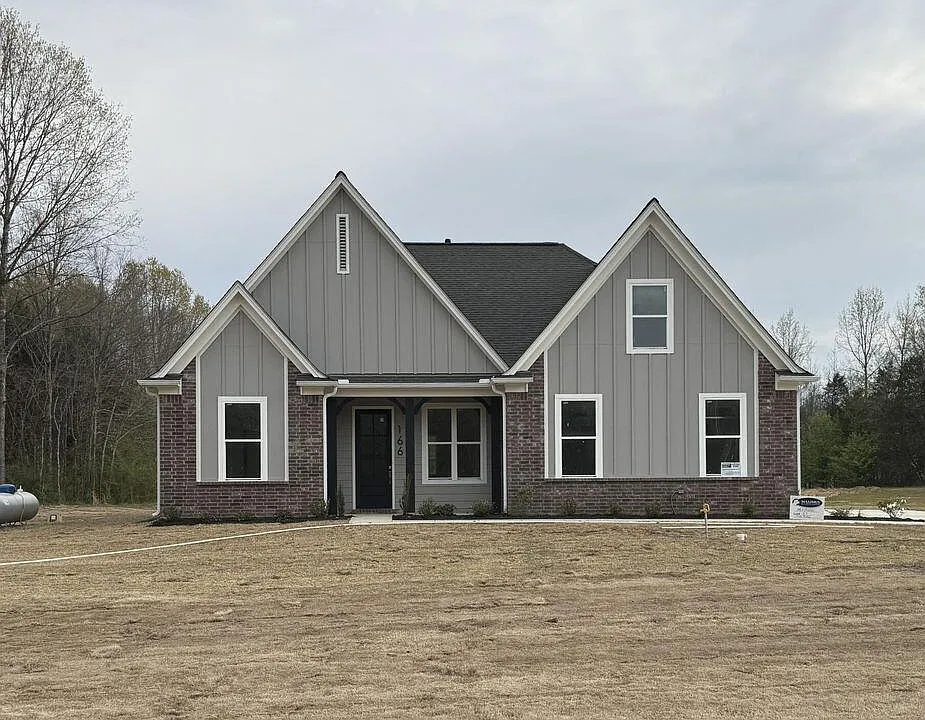
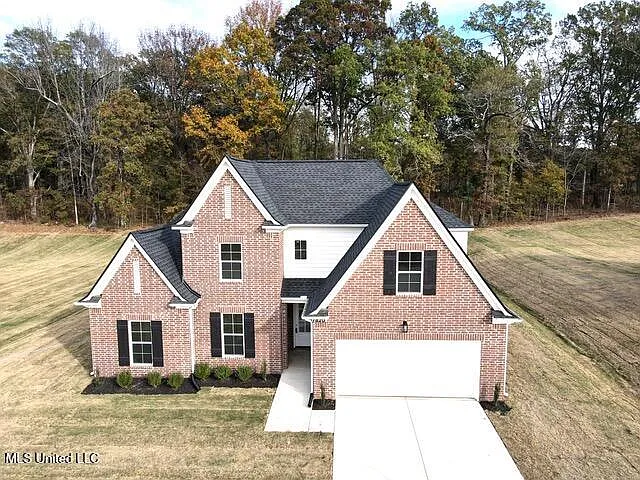
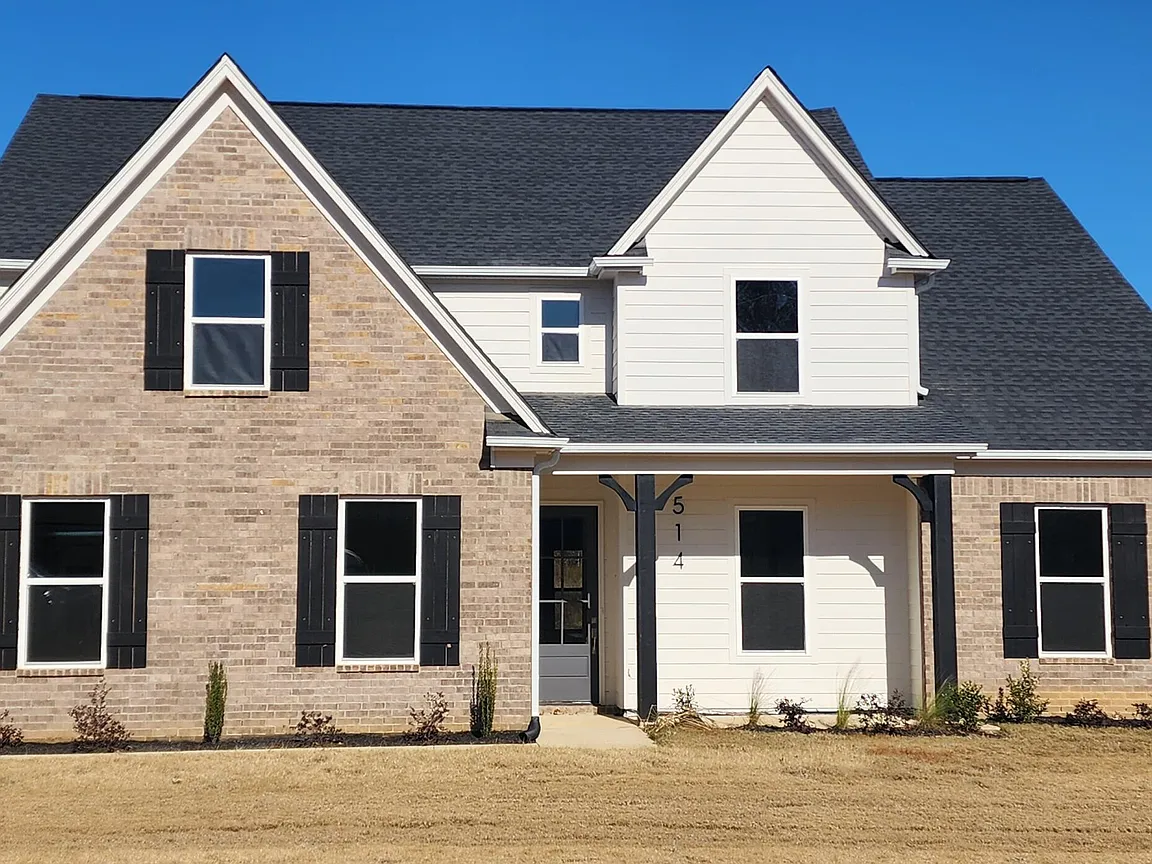
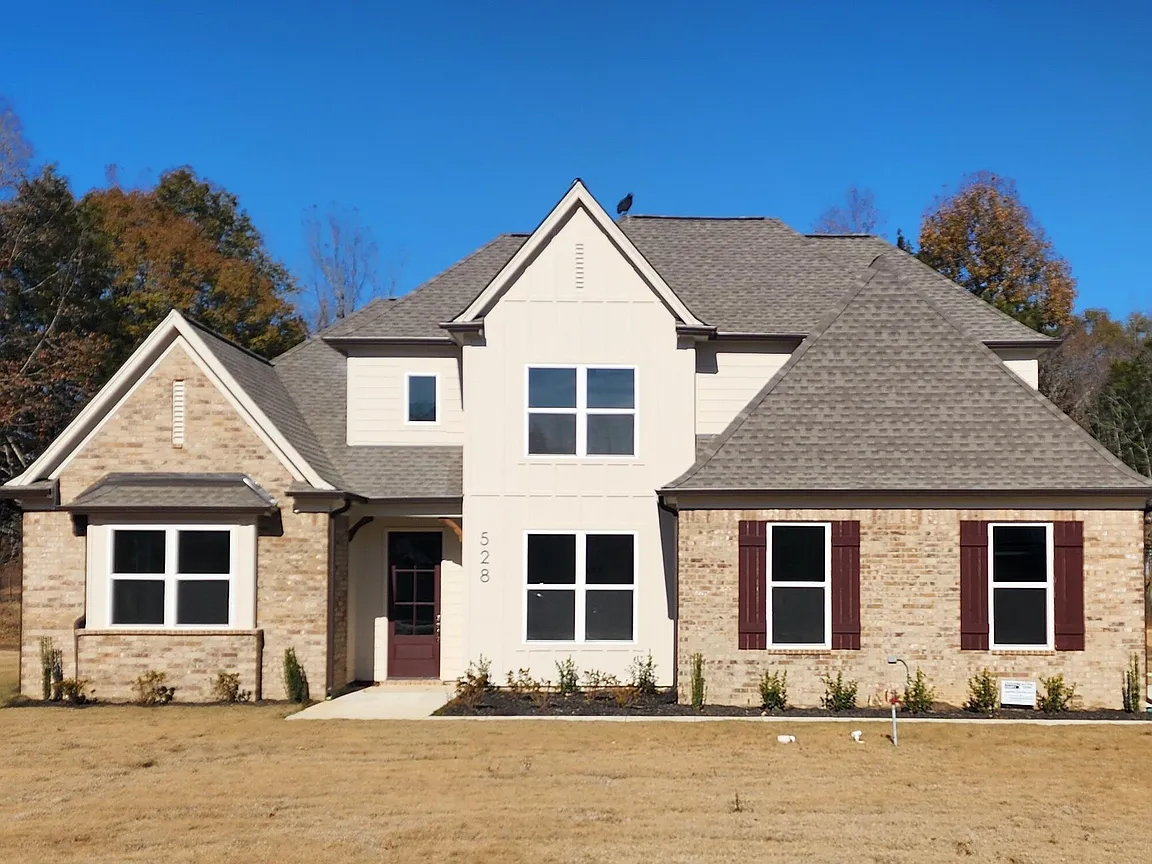
Silo Ridge Estates in Byhalia, Mississippi offers modern farmhouse-style homes on spacious acre-plus wooded parcels, just minutes from Memphis. Built new for long-term value, each property combines energy-efficient construction with open, tenant-friendly layouts and low-maintenance finishes.
Located in a landlord-friendly market with strong rental demand, these homes are professionally managed for turnkey ownership. Ideal for out-of-state buyers and 1031 exchange investors, Silo Ridge Estates delivers high-performing investment properties near Memphis with the durability and appeal to attract quality tenants year after year.
Meridian will fly you and a guest to Memphis to tour available properties, meet our team, and explore the market firsthand—at no cost to qualified investors.
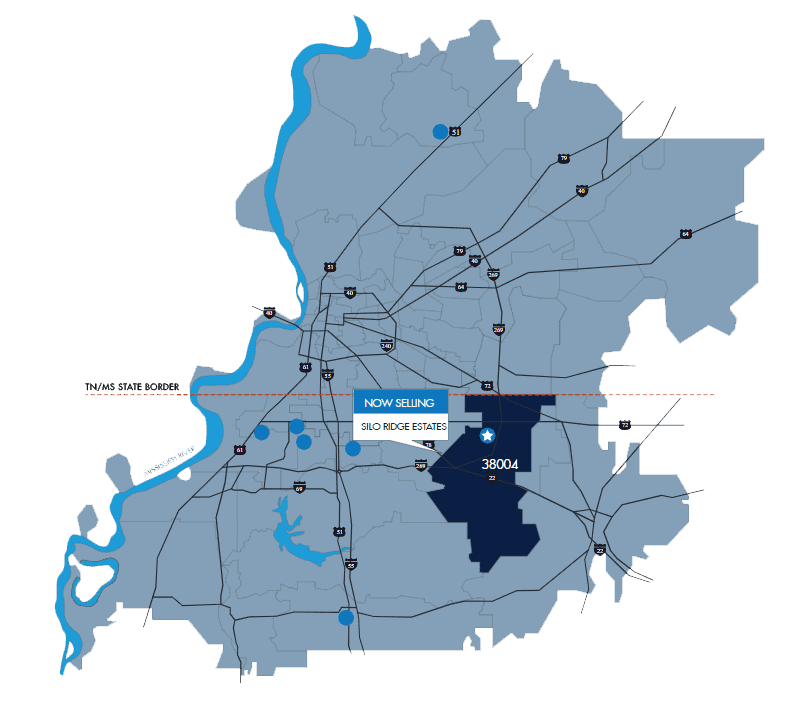
Byhalia, Mississippi, is strategically located near the junction of Interstate 22/Route 78 and Interstate 269, positioning it as a prime growth corridor within the Memphis metro. This convenient access is attracting major employers to the area, supporting strong job growth and a healthy rental market. The town offers the charm of a small community, with a traditional main street lined with boutique shops and locally owned businesses, yet remains fully connected to the economic drivers of the region. Residents enjoy a welcoming atmosphere, friendly neighbors, and a highly engaged city staff committed to supporting the community’s growth and quality of life. For investors, Byhalia’s location provides easy commutes to the Chickasaw Industrial Park, Collierville, Olive Branch, and downtown Memphis — all thriving employment centers that help sustain demand for well-built rental homes. This blend of accessibility, economic momentum, and small-town appeal makes Byhalia a compelling choice for those seeking high-performing investment properties near Memphis.
Have Questions About Investing? Let’s Talk.
Speak with an experienced advisor about our fully managed rental properties — no pressure, just data, insights, and answers.