Pending

9060 Lakeside Circle South

Walls, MS 38680
5 Bedrooms
3 Baths
2,200 S.F.
0.24 Acres

Buy this property for $0 and earn $0 per month in estimated rent.

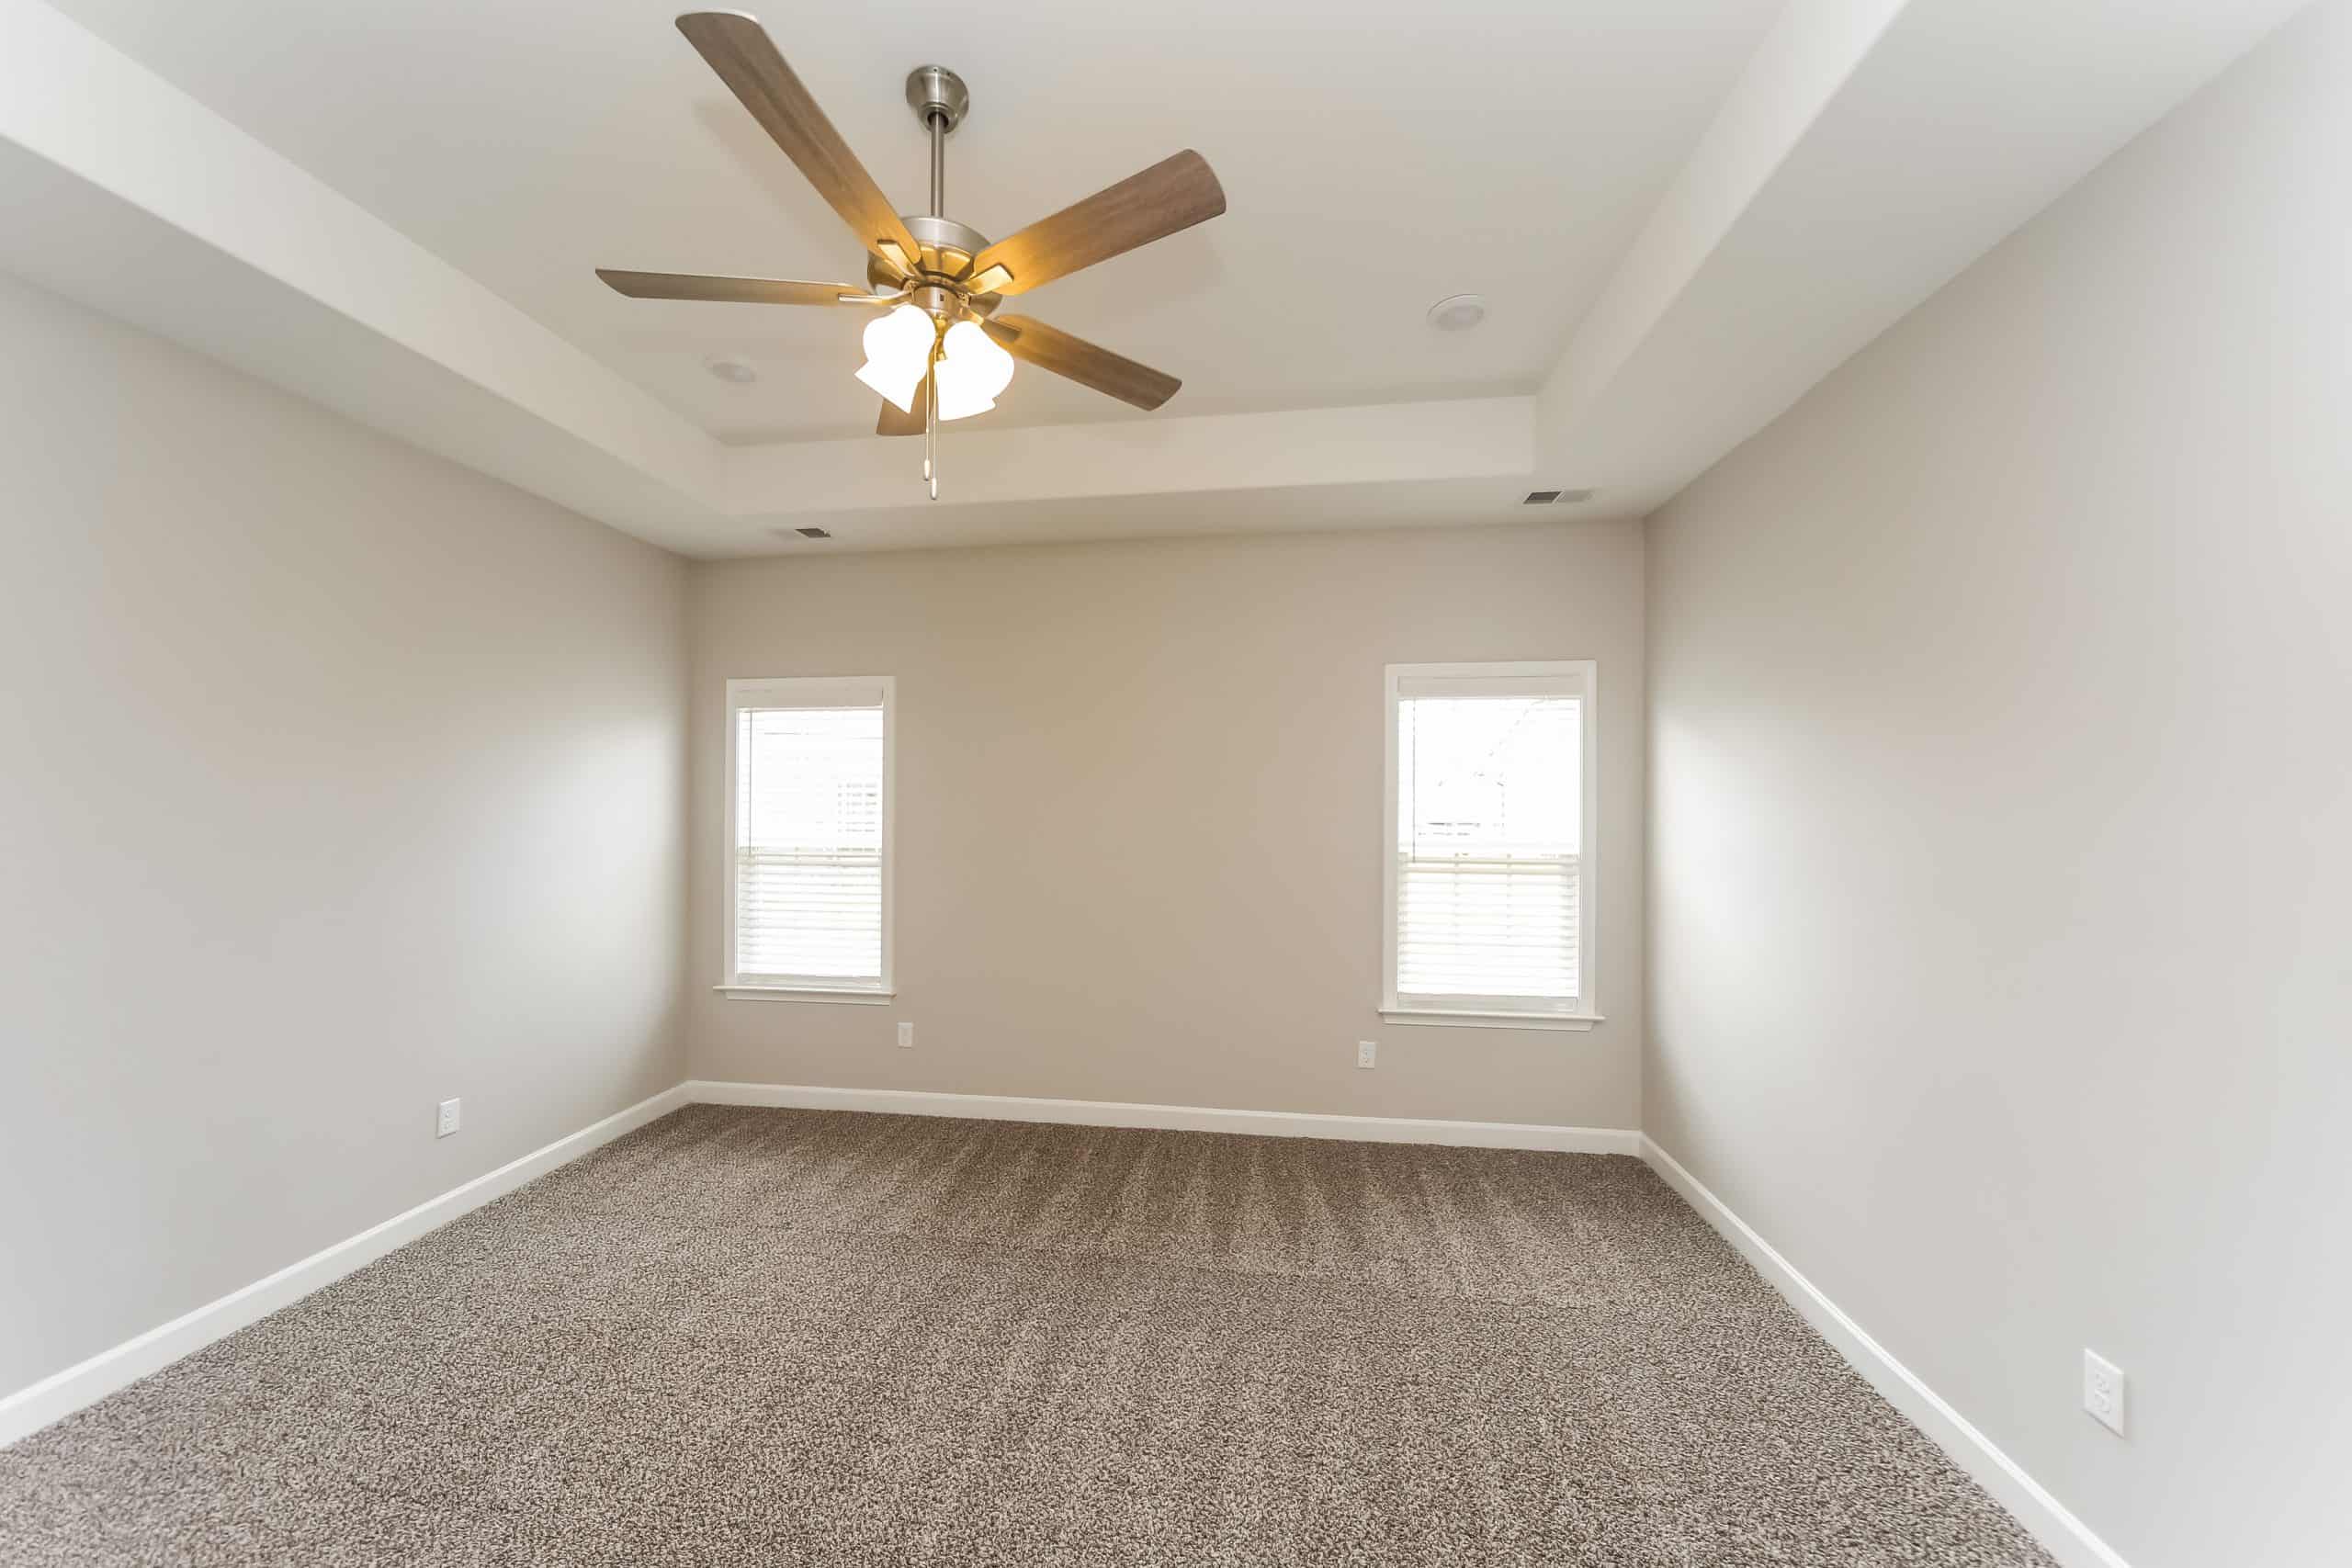
These photos are of a similar property with the same floor plan and same elevation. Actual colors and finishes may vary.

About

Welcome to The Dove – the perfect open-concept plan for you and your family. This plan’s main level offers an expansive family room bathed in natural light throughout the day. Its electric fireplace, with floating cedarwood mantle, provides a cozy focal point. Nearby, the elegantly appointed kitchen features white Shaker cabinets and granite countertops. The main-level primary bedroom provides the perfect, secluded haven to unwind at the end of the day with a beautiful en-suite bathroom and dual walk-in closets. Opposite the primary bedroom are 2 bedrooms and a bathroom. Upstairs, the Dove has an additional bedroom, bathroom, and bonus room.

Features

Flooring:
  • LVP flooring in bathrooms
Bathrooms:
  • Marble tub
Appliances:
  • Garbage disposal
Kitchen:
  • Kitchen/family room view
Construction:
  • Garage doors and openers
Climate:
  • Ceiling fans
Exterior:
  • Curbs and sidewalks

Figures

5 Bedrooms
3 Baths
2,200 S.F.
Floor Plan: Dove
Elevation A
2 Levels
0.24 Acres
Built in 2023
2 Garage Spaces

Location

An up-and-coming town in northern DeSoto County under 10 minutes from the Memphis city limits, Mallard Park offers ample opportunities for dining, recreation, entertainment, and shopping in the nearby city of Southaven (Mississippi’s third largest). This is a family-friendly community with above-average schools and a regional library branch with services for life-long learners. There is an engaged, local government and city staff committed to its citizens.
County:
DeSoto
City:
Walls
State:
Mississippi
Zipcode:
38680
Community:
Mallard Park
Lot:
97

Get Directions

Finances

Sales Price:
$0
Annual HOA:
$400 [ $33.33 per month]
Annual Insurance Premium:
$875

Propery Portfolio

Save your favorite properties to compare and evaluate investment opportunities.

Investor Calculator

PROPERTY INCOME AND OPERATING EXPENSE DATA
?
Enter the Monthly Rent, Annual Property Tax and Annual Insurance Premium amounts here. The tax information is available on most county property tax websites. The insurance information is available from the insurance company. It is important to research whether or not the property is located in a homeowner’s association that carries Homeowner’s Association (HOA) fees. If so, enter the annual amount.
Monthly Rent*
Annual Property Tax
Annual Insurance Premium
Annual HOA Fees / Other
ACQUISITION AND DEBT SERVICE SUMMARY
?
Enter Purchase Price of the property. If you are financing the property, enter the Down Payment percentage here. For most investors, it’s usually a number between 20-30%. For a cash purchase, enter 100%. Next, enter the Closing Costs & Fees. If you are working with a lender, she can give you a good faith estimate for this line item.
Property Purchase Price
Down Payment
=
50%
Mortgage Interest Rate (30 Yr Fixed)
50%
Closing Costs & Fees
ECONOMIC MODELING ASSUMPTIONS (PER YEAR, FOR 10 YEARS)
?
In this section, you need to make some assumptions about the property as indicated to the right. Vacancy Rate: Percentage of Gross Scheduled Income (GSI) or total annual rents possible per year. Maintenance Rate: Percentage of Gross Operating Income (GOI), or the income the property receives after accounting for vacancy. Property Management Rate: Percentage of GOI, the amount of rents actually collected by the property manager. Property Appreciation Rate: Your expectation of how the property value will appreciate. Expense Inflation Rate: The general economic inflation percentage rate. Sales Costs: Costs associated with selling property when it is finally sold, including sales commissions and closing costs. This is a one-time expense.
Vacancy Rate (% of GSI)
% Advanced +
Year 1%
Year 2%
Year 3%
Year 4%
Year 5%
Year 6%
Year 7%
Year 8%
Year 9%
Year 10%
Maintenance Rate (% of GOI)
% Advanced +
Year 1%
Year 2%
Year 3%
Year 4%
Year 5%
Year 6%
Year 7%
Year 8%
Year 9%
Year 10%
Property Mgmt Rate (% of GOI)
% Advanced +
Year 1%
Year 2%
Year 3%
Year 4%
Year 5%
Year 6%
Year 7%
Year 8%
Year 9%
Year 10%
Property Appreciation Rate
% Advanced +
Year 1%
Year 2%
Year 3%
Year 4%
Year 5%
Year 6%
Year 7%
Year 8%
Year 9%
Year 10%
Rent Appreciation Rate
% Advanced +
Year 1%
Year 2%
Year 3%
Year 4%
Year5%
Year 6%
Year 7%
Year 8%
Year 9%
Year 10%
Expense Inflation Rate
% Advanced +
Year 1%
Year 2%
Year 3%
Year 4%
Year 5%
Year 6%
Year 7%
Year 8%
Year 9%
Year 10%
Sales Cost Rate (% of Price)
%
INVESTMENT AND DEBT SERVICE CALCULATIONS
?
Investment and debt service calculations: Based on the data entered above, the investor’s total cash investment, and the monthly and annual debt service is calculated here.
Property Purchase Price
Down Payment
Closing Costs & Fees
Total Cash Investment
DEBT SERVICE SUMMARY
?
Investment and debt service calculations: Based on the data entered above, the investor’s total cash investment, and the monthly and annual debt service is calculated here.
Amount Financed
Debt Service (P&I), Monthly
Debt Service (P&I), Annual
KEY FINANCIAL RATIOS (RETURN ON INVESTMENT)
?
Key Financial Ratios are calculated as 10-year averages to the right based on the data entered above. 10-Year Average Cash on Cash ROI – ten year average of cash on cash (CoC) return. Cash-On-Cash ROI + Debt Pay Down – this is the combined return of the debt pay down and the cash on cash return. 10-Year Average Capitalization Rate – 10 year average of annual Net Operating Income of the property divided by its purchase price. This is the approximate annual CoC return for an all-cash purchase. 10-Year Internal Rate of Return (IRR) – the annual return accounting for the amount invested, cash flow earned through rents, pay down of the mortgage loan, and appreciation realized from the sale of the property. IRR is an overall return on investment metric that accounts for the amount and timing of all cash flows disbursed and received each year.
10-Year Average Cash-On-Cash ROI
Avg 10-Year CoC
Cash-On-Cash ROI + Debt Paydown ROI
Avg 10-Year CoC + Debt Paydown ROI, Excl. Appreciation
Capitalization Rate (First Year)
First Year Net Operating Income ÷ Purchase Price
10-Year Internal Rate of Return
IRR per Year
Want a copy of the results?

About the calculations

The calculations and data presented herein are deemed to be accurate, but accuracy is not guaranteed. The projected proforma returns on investment are intended for the purpose of illustrative projections to facilitate analysis and are not guaranteed by Meridian Pacific Properties, Inc. or its affiliates and subsidiaries. The information provided herein is not intended to replace or serve as a substitute for any legal,real estate, tax, or other professional advice, consultation or service. The prospective buyer should consult with a professional in the respective legal, tax, accounting, real estate, or other professional area before making any decisions or entering into any contracts pertaining to the property or properties described herein.

Monthly Rent *

Represents the middle point of an expected rent range. We expect the rent to be within $50 of the estimated rent. Meridian helps to protect the rental income for our investors through our rent warranty program. Please call Meridian Pacific Properties directly for more information.

🔐 Unlock Premium Content

Create a free account for full website access and exclusive benefits.

🚀 Builder Incentives
🏡 Premium Property Access
💰 Advanced ROI Calculator
📊 The Investor Newsletter
✅ More!

Already have an account? .

🔐 Unlock Premium Content

Sign in for full website access and exclusive benefits.

🚀 Builder Incentives
🏡 Premium Property Access
💰 Advanced ROI Calculator
📊 The Investor Newsletter
✅ More!

New to our website?